In this paper
- Summary
- Why put a dollar figure on OT cyber risk
- FAIR in one page
- Where FAIR works well
- Where FAIR stops short in OT
- The OT attack flow, from intent to loss
- Controls on both sides of the incident
- Consequences: the DeRISK Consequence Model
- Three real incidents through the flow
- What it means for operators, insurers and investors
- Why simulation, and where the discipline goes next
- Glossary
- Works Cited
Summary
FAIR (Factor Analysis of Information Risk) is a widely used method for putting a dollar figure on cyber risk, and it does that job well for data breaches, privacy events and financial fraud. Industrial control systems are a different problem. When an attacker reaches a control system, the loss can include a damaged furnace, a ruptured pipeline, spoiled product, an injured worker or a chemical release — and FAIR, as published, has no place to put most of that.
This paper walks through the gap one link at a time: who attacks, what they target, how they get in, what stops them, what physical event follows, and what it costs. At every link, the published FAIR material stops short of the plant floor. The most important missing piece is the peril, a term long used in the insurance industry for the physical event that causes a loss. Here it is the physical event between the cyber attack and the money: fire, explosion, overheating, loss of containment. In the incident record, a peril only appears when an attack reaches the control system and pushes the process past a safe limit while the protection layers are out of the way.
DeNexus™ applies FAIR's core logic in OT environments through two methods of our own. The DeRISK Control Model scores the controls on both sides of an incident — those that prevent the compromise, lowering frequency, and those that stop it becoming a physical event, lowering magnitude. The DeRISK Consequence Model — a cyber-physical loss taxonomy for industrial environments — organizes more than 40 OT loss types into nine families, from business interruption to environmental cleanup. Three real incidents show the approach end to end: a German steel mill (2014), the San Bruno pipeline explosion (2010) and the 2026 attack on French supermarket refrigeration.
Why put a dollar figure on OT cyber risk
Boards, insurers and investors make decisions in money, not in maturity scores or heat maps. Cyber risk quantification (aka., CRQ) answers the questions they actually ask: how much could we lose in a typical year, how bad is a bad year, and which investment reduces that loss the most. A maturity score of 2.5 out of 5 cannot be compared with the cost of a new safety system; an expected annual loss can.
The stakes in industry are large. Dragos and Marsh McLennan put OT cyber at roughly $31.1B in annual financial risk — and up to $329.5B in a severe (1-in-250-year) event.1 Yet the evidence behind those losses is thin and easy to misread. The OT incident research I initiated started with 60 well-documented OT incidents, each chosen because it touched industrial operations. Only about a dozen of them are malicious attacks that produced a physical peril, and for a third of those either the cyber cause or the damage is still disputed.2 The large OT losses we do see — Colonial Pipeline, Norsk Hydro, Jaguar Land Rover — came mostly from downtime and response cost, not from anything breaking.
That is exactly why the way a risk model is built matters. A model that only knows about downtime will understate a plant where a compromise can become a fire, and a model that assumes every attack ends in an explosion will overstate the rest. Getting it right means modelling the physical path between the two, and that path is where the existing standards stop.
FAIR in one page
FAIR breaks risk into two questions: how often will a loss happen, and how much will it cost when it does. The standard is published by The Open Group as Open FAIR (O-RT, the risk taxonomy3, and O-RA, the risk analysis4), and the FAIR Institute publishes companion models on top of it.
Risk = Loss Event Frequency × Loss Magnitude
How often (Loss Event Frequency). This is how often a threat acts against an asset (threat event frequency) multiplied by how likely that action is to succeed (vulnerability). A loss event happens when a threat breaches or impairs an asset — and in FAIR's own words, that asset is an information system or one of its components.3
How much (Loss Magnitude). FAIR sorts every cost into six forms of loss, and labels each as a primary loss (borne directly by the organization) or a secondary loss (arising from how others react — regulators, customers, courts).
| Form of loss | What it covers |
|---|---|
| Productivity | Lost revenue and output while operations are degraded or stopped |
| Response | Costs to manage the event: investigation, legal, notification, recovery |
| Replacement | Repairing or replacing damaged assets |
| Fines and judgments | Regulatory penalties, settlements and legal judgments |
| Competitive advantage | Lost advantage when proprietary information is exposed |
| Reputation | Lost customers, market value or cost of capital |
The scenario sentence. In February 2025 the FAIR Institute proposed a taxonomy for writing risk scenarios in one consistent sentence: [threat actor] impacts [asset] via [method], causing [effect]. Its own worked example is a cybercriminal who takes company funds through business email compromise. The taxonomy is published for community feedback and is not yet a FAIR standard.5–6
FAIR-MAM. The FAIR Materiality Assessment Model (FAIR-MAM) expands the how much side into ten cost modules — business interruption, information privacy, network security, cyber extortion and others. It was built to help public companies decide whether an incident is material under the SEC's cyber disclosure rule (Form 8-K Item 1.05)7, and it fills the effect slot of the scenario sentence. FAIR-CAM, the FAIR Controls Analytics Model, does the same for controls: it describes how each control function changes frequency or magnitude.8
Where FAIR works well
FAIR earned its place. Before it, most cyber risk registers held statements like "phishing is a big risk" — a control gap or an audit finding with no threat, no asset and no loss attached. FAIR forces each of those into a scenario that can be measured, compared and prioritized, and it gives risk owners, finance teams and insurers one shared vocabulary for loss.
It fits best where the loss path is short and well understood. In a data breach, a threat reaches a database, records are exposed, and the costs follow a familiar list: forensics, notification, credit monitoring, regulatory fines, lawsuits and lost customers. In financial fraud, an attacker redirects a payment and the loss is the money itself plus recovery and liability. In ransomware on business systems, the loss is mostly downtime, recovery labor and, sometimes, the ransom. Insurers have priced these events for two decades, and FAIR-MAM's modules map cleanly onto them.
None of this is a criticism. FAIR was designed for information systems, and for information systems it remains the strongest open method available. The problem starts when the asset behind the screen is a furnace, a pump or a pipeline.
Where FAIR stops short in OT
FAIR was built for IT, and in OT every link in the chain stops short. A complete OT risk scenario has at least eight links. The first half decide how often a compromise happens; the last half decide how much it costs once it has.
| Link | The question it answers | FAIR side | What the published FAIR material covers | What OT needs |
|---|---|---|---|---|
| Threats | Who attacks, and how often? | How often | IT threat actors | Equipment makers, integrators and vendor remote access; supply chain, accidents and insiders |
| Assets | What do they target? | How often | Data and business processes | Control systems, safety systems, equipment, machinery, instrumentation, and the physical process they run |
| Methods | How do they attack? | How often | IT attack methods | Loss of view, loss of control, manipulation of control (MITRE ATT&CK for ICS) |
| Pre-incident controls | Does the compromise happen? | How often | FAIR-CAM's published mappings cover IT frameworks only8 | OT frameworks such as ISA/IEC 62443 and NIST SP 800-82r3 |
| Post-incident controls | Does it escalate to a physical event? | How much | No place for the safety layer | Safety instrumented systems, protective relays, mechanical protection, operators, cyber-informed engineering (CIE) |
| Perils | Which physical event? | How much | No concept of a physical peril | Fire, explosion, overheating, loss of containment and 20+ others |
| Effects | What does it damage? | How much | Built for IT losses; the only physical damage is servers and laptops | Equipment, product, people, the environment, neighbors |
| Cost drivers | What does it cost? | How much | Itemized for IT incidents | Plant repair, make-safe works, pollutant cleanup, lost contribution margin and 70+ more |
Two of these gaps matter more than the rest. The first is the peril, the insurance industry's word for the physical event that causes a loss, such as a fire or an explosion. FAIR has no box for that event between a compromised controller and a damaged furnace. In FAIR's terms, by the time the furnace overheats the loss event (the controller being taken over) has already happened, so the peril sits inside how much — the physical mechanism that turns an impaired controller into a destroyed asset. The second is the post-incident control: the safety system that trips the plant, the relief valve that lifts, the operator who notices. In IT those controls barely exist; in OT they are often the last and strongest line between a cyber event and a physical one.
The OT attack flow, from intent to loss
An OT incident runs from intent to loss. The early stages are about computers and the people attacking them; the later stages are about the physical process and what it costs. FAIR's scenario sentence holds the early stages well. The later stages are where OT adds its own steps.
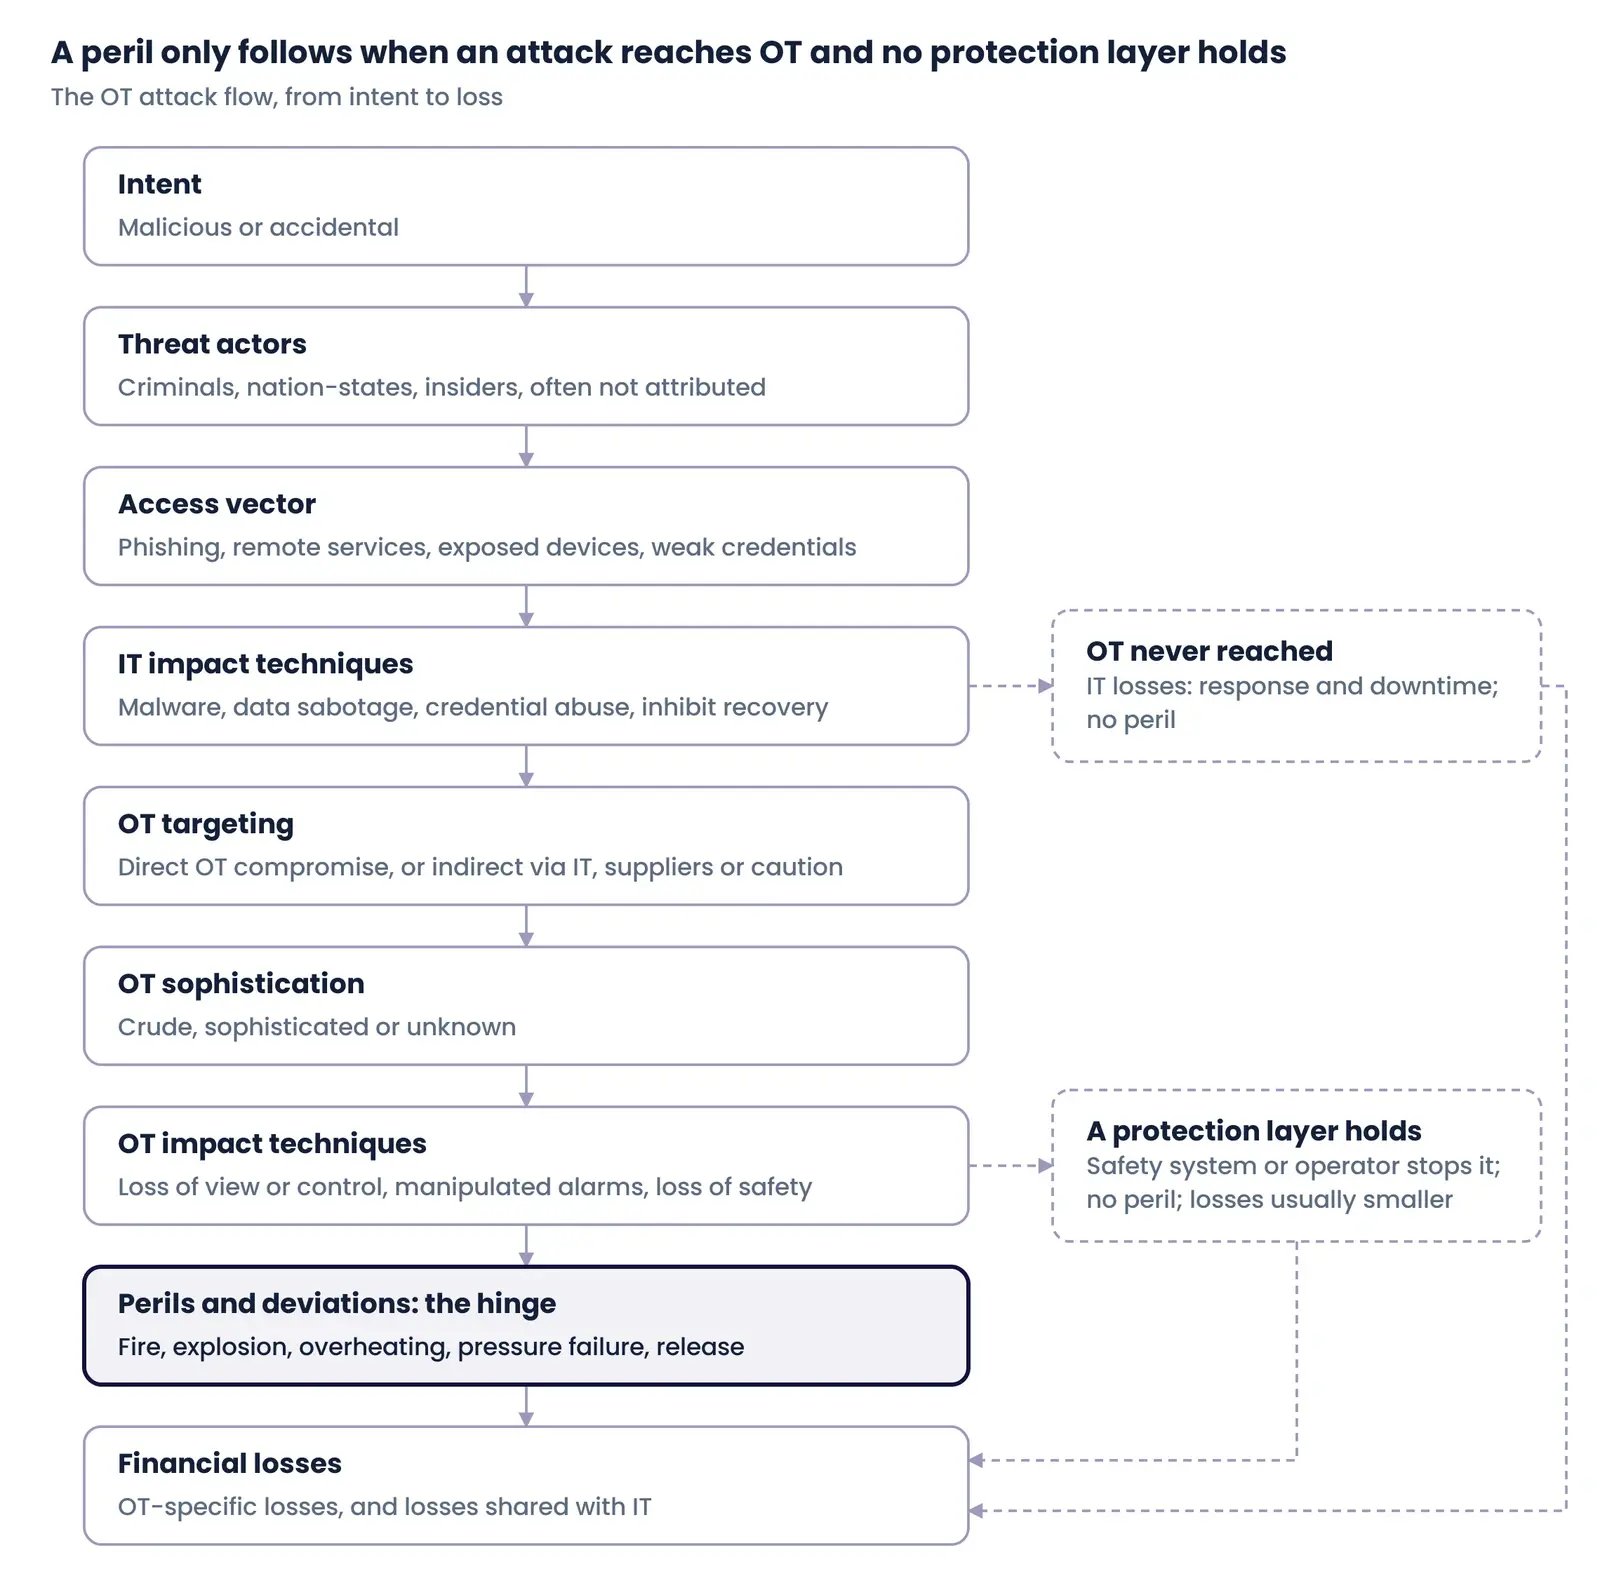
Most attacks leave the flow at one of two exits: they never reach OT, or a protection layer holds. Only the ones that pass both end in a peril. Both exits still lead to financial losses — usually IT-only, or less severe.
Intent. Malicious or accidental. FAIR counts error and failure as threats, but its scenario examples are all attackers. In OT the accidental case is common and expensive — at San Bruno, nobody attacked anything.
Threat actors. Cyber criminals, nation-states, hacktivists, disgruntled or unaware insiders, cyber terrorists — and often not attributed at all. Many OT incidents never get a confirmed actor, so the model has to work without one.
Access vector. How the attacker got in: phishing, removable media, an exposed internet-facing device, default or weak credentials, external remote services, supply chain, drive-by compromise. These are largely shared with IT.
IT impact techniques. What the attacker did on business systems: malware, data sabotage, inhibiting recovery, credential manipulation, privilege abuse, data theft. If the story stops here, the loss is cyber incident response and downtime — no peril.
OT targeting. Whether the control system itself was touched. Direct OT compromise means the attacker impaired or mis-operated industrial control assets. The indirect paths stop operations without touching them: an IT system the plant depends on goes down, a supplier is hit, the operator shuts down out of an abundance of caution, or a shared external signal (such as the GPS jamming and spoofing linked to ship groundings in 2024 and 20252) is attacked. These categories follow the 2026 OT Cyber Threat Report from ICS-STRIVE and Waterfall Security Solutions,9 with the external-signal path added by DeNexus.
OT sophistication. How much process knowledge the attacker's actions show. Crude effects are noticed at once — a screen goes dark, an alarm sounds. Sophisticated effects need enough process knowledge to fake normal readings or disable safety. Often it is simply unknown.
OT impact techniques. What happened to the process, using MITRE ATT&CK for ICS impact categories10: loss or denial of view, loss or denial of control, manipulation of alarms, view or control, inhibiting response, loss of protection and loss of safety.
Perils and deviations. The physical event: fire, explosion, pressure failure, loss of containment, water damage, machinery breakdown, collision or derailment, contamination, centrifugal force, overheating — or no peril at all. Bricking belongs here only when a device is damaged beyond restoration and must be replaced, which turns it into a property loss; firmware corruption that can be restored by reflashing is not the bricking peril. Perils work as a loss amplifier in the whole flow.
Financial losses. What it costs, split into OT-specific losses (property, equipment and materials; casualty, health and safety; cyber-physical incident; environment) and losses familiar from IT (business interruption, data loss, hardware bricking, cyber incident response, reputation damage).
The most useful finding in our incident research is what makes the hinge swing. Across nearly 60 documented OT and cyber-physical incidents,2 every one with a peril reached a physical process, and none that stayed on IT systems produced one — Colonial Pipeline, Norsk Hydro and Clorox were large losses with nothing physical in between. But reaching OT is not enough. A peril needs the attack to push the process past a safe limit while the protection layers are out of the way. At the Petro Rabigh plant in 2017, attackers reached the safety controller (TRITON) and the safety system tripped the plant as designed.11 At Oldsmar in 2021, an operator saw the sodium hydroxide setpoint change on screen and reversed it.12 Both reached OT; neither produced a peril.
Controls on both sides of the incident
Controls work at two points in the flow, and a useful OT model has to credit both. Prevention controls decide whether the compromise happens at all: segmentation, secure remote access, multifactor authentication, hardening, patching, training. They lower how often a loss happens (loss event frequency). Detection, response and recovery controls decide how far a compromise travels and how fast the plant gets back: monitoring, incident response, backups, manual operation, and the engineering and safety layers that stop a compromised controller from becoming a physical event. They lower how much it costs (loss magnitude).
The DeRISK Control Model is the DeNexus framework for scoring both. Anyone familiar with NIST CSF will recognize its top-level functions, but they are built for financial quantification: for each control we evaluate how it reduces the probability of an incident (frequency) and, if one happens, how it reduces the severity of the consequence (magnitude). In DeRISK™ CRQ it sits alongside ISA/IEC 62443 and NIST SP 800-82r3 as one of three frameworks a customer can assess against.
The incident record shows why the second side matters. Where a peril happened, the control that could have stopped it was an engineering or human layer that was missing, defeated or bypassed. Where OT was reached and nothing physical followed, one of those layers held.
| Incident | What stood between the attack and a peril | Did that barrier stop the peril? | Peril |
|---|---|---|---|
| German steel mill, 2014 | A controlled shutdown of the blast furnace | No — the attack prevented controlled shutdown | Overheating |
| San Bruno, 2010 | Pressure protection and the operators' view of the line | No — power to the instruments was lost | Pressure failure, then explosion and fire |
| Petro Rabigh (TRITON), 2017 | The safety instrumented system itself | Yes — it tripped the plant | None |
| Oldsmar, 2021 | An operator watching the screen | Yes — the setpoint was reversed | None |
| French supermarkets, 2026 | Temperature alarms on the same controller the attacker held, and staff on site | Mostly no — only where a person noticed | Overheating |
This has a consequence for how controls are modeled. If a safety system is treated only as something that softens the cost after a compromise, it is under-credited; in practice it is often the last barrier before a peril. The control instruments published for FAIR map to IT frameworks and say nothing about safety instrumented systems, protective relays or relief valves. Building that safety layer into the post-incident side is where the DeRISK Control Model is being extended.
Consequences: the DeRISK Consequence Model
The DeRISK Consequence Model — a cyber-physical loss taxonomy for industrial environments — names what an OT incident can cost, from a damaged furnace to a lost customer. It holds more than 40 loss types that apply to OT, grouped into nine families. Four families are specific to OT; five are shared with IT but defined here in OT terms.
One rule keeps the totals honest: the physical event is the trigger, and each cost lands in exactly one loss type. A repair is never counted twice under two names.
| Family | Kind | What it covers | Loss types |
|---|---|---|---|
| Cyber-Physical Incident | OT-specific | The immediate response to a cyber-enabled physical event, and its effects on people and property outside the fence | Cyber-Physical Event Response · Third-party Physical / Societal Impact · Industry Regulation Liability · Cyber-Physical Cover Response |
| Property, Equipment & Materials | OT-specific | Damage to the plant, its equipment and its product, and the work to bring it back to safe operation | First-party Property Damage · Third-party Property Damage Liability · Materials & Product Loss · Asset Degradation · Equipment Repair / Replacement · Startup and Return-to-Service Validation |
| Casualty, Health & Safety | OT-specific | Harm to people, and the medical, regulatory and engineering consequences that follow | Bodily Injury · Loss of Life · Medical Liability · Process Safety Engineering · Safety Regulation Liability |
| Environment | OT-specific | Releases to the environment, their cleanup, and the regulatory liability that follows | Spills / Cleanup · Environmental Regulation Liability |
| Business Interruption | Shared | Lost output when production or service stops or slows, and the obligations that follow | Direct Business Interruption · Contingent Business Interruption · Business Interruption Liability · Manual Operations / Workarounds · Contract Violation / Obligation |
| Data Loss | Shared | Loss of the integrity, confidentiality or availability of engineering, process and production data | Production Data Integrity · Proprietary Data Response and Recovery · Proprietary Data Future Revenue Loss · Proprietary Data Loss Liability |
| Hardware Bricking | Shared | Replacing devices left unusable or untrustworthy, from servers to field controllers | Embedded Device Replacement · Network Device Replacement · Server Replacement · Computer / Laptop Replacement |
| Cyber Incident Response | Shared | Investigating, containing and recovering OT networks and systems, and the security improvements that follow | Network Event Response and Recovery · Ransom / Extortion · Network Security Liability · Voluntary Improvements · Legally-Mandated Improvements |
| Reputation Damage | Shared | Longer-term losses through customers, markets, capital and the workforce | Public Relations Response · Customer Retention · Future Projects and Sales Loss · Market Valuation · Cyber Insurance · Cost of Capital · Employee Churn |
The model also sets aside the losses that have no OT pathway — personal-data privacy, payment fraud and media liability — so they are recorded when they occur inside an OT incident but never inflate the OT picture. Where a cost is only possible, the model says so: the San Bruno and steel mill cases below separate confirmed figures from losses that are implied but not costed.
Three real incidents through the flow
Each case below runs through the flow from intent to loss. Together they show a malicious attack whose physical outcome may have been unintended, an accident with no attacker at all, and a crude attack that hit hundreds of sites in one night.
Real incident — German steel mill blast furnace (2014)
Flow: spear phishing > corporate network > production network > blast furnace cannot shut down in a regulated way > overheating > "massive damage to the plant".
Read the DeNexus incident analysis
Germany's BSI reported the attack in its 2014 annual report without naming the plant, the actor or how the attackers moved into the production network.13 The intrusion was malicious, but whether the damage was the goal is not settled: the SANS analysts who first studied it inferred intent,14 while a 2022 Idaho National Laboratory reconstruction attributes it to Havex espionage malware whose network scanning likely knocked out control of a 21-year-old furnace.15 OT sophistication is therefore unknown. INL estimates roughly $4 million to repair the furnace and control equipment and $6 million in lost revenue and productivity; no 2014 source gave any figure, and the furnace's return-to-service work was never costed.
What it shows: an IT-borne intrusion that crossed into OT and defeated a shutdown is enough to produce a peril, whether or not the attacker intended one.
Real incident — San Bruno pipeline explosion (2010)
Flow: UPS replacement work at a terminal > erratic power to pressure transmitters > false low-pressure signal > regulating valves fail fully open > pressure failure on a defective 1956 pipe > rupture > explosion and fire.
Read the DeNexus incident analysis
Nobody attacked anything. A control-system failure during routine electrical work raised pressure on Pacific Gas and Electric's Line 132 to 396 psig, and a mis-recorded, poorly welded pipe section ruptured in a residential neighborhood. Eight people died, 58 were injured, 38 homes were destroyed and 70 damaged.16 The costs PG&E paid, forwent or could not recover total about $2.44 billion, of which $515 million was recovered from insurance against third-party claims.17 The losses run across almost every OT family: $1.6 billion in regulatory penalty and mandated safety work,18 $558 million in third-party injury, death and property claims, $70 million to the City of San Bruno,19 and about $13.5 million to repair the pipeline itself.16
What it shows: the most expensive losses in the record are often not the damaged equipment but the liability and regulation that follow harm to people, and an accident travels the same right-hand path as an attack.
Real incident — French supermarket refrigeration attack (2026)
Updated 22 October 2026. Expect new information after this date to change this analysis.
Flow: internet-exposed refrigeration controllers > access method still unconfirmed > defrost forced to 50 °C for six to eight hours, alarms delayed or silent > overheating > stock destroyed, fires reported.
Read the DeNexus incident analysis
On the night of 11 to 12 October 2026, someone reached the refrigeration supervisory controllers of about 700 French supermarkets, by the government's count,20 and put display cases, cold rooms and freezers into a forced defrost. The equipment was older Danfoss controllers, most no longer receiving updates, and some Copeland and Dixell units, left reachable from the internet for contractor maintenance.21 How the login was passed is not established, and nobody has claimed the attack. The attack was crude — the device's own defrost function used through its own interface — and it reached the OT directly with no IT step at all.
Stores that noticed in the night fixed it by hand; the rest opened to warm cabinets and threw out all fresh and frozen stock on food-safety grounds. Les Mousquetaires' president put the industry's loss at "tens of millions of euros" in a single day,22 the manager of one Intermarché put that store's loss at EUR 50,000,23 and the Paris prosecutor counts fires among the reported damage.22 Intermarché has said its insurance does not cover this type of incident.24
What it shows: a crude attack on building-services OT, with no safety system in the way, can produce a peril at hundreds of sites in one night — and the alarm that should have caught it sat on the same device the attacker held.
What it means for operators, insurers and investors
You cannot quantify what you do not model, and an IT-only loss model systematically understates industrial exposure. The practical consequences differ by who is reading.
Operators. The question is no longer only "can they get in?" but "if they get in, what stands between them and a peril?" That shifts attention to the post-incident side: whether safety instrumented systems are independent of the control network, whether alarms live on the same device an attacker would hold, whether operators can run the process by hand, and whether anyone is awake at 04:00 to notice. Those controls rarely appear in an IT-shaped risk register, yet in the record they decided whether an incident became a fire.
Insurers. In our review of specimen policy wordings,2 an OT operator's insurance program tends to be strongest exactly where its OT exposure is weakest. Personal-data privacy is the best-covered loss family, while property, casualty, environmental and cyber-physical losses are reached by little or nothing in a cyber policy. In Europe, cyber-caused fire and explosion often sits in property books — covered, but unpriced. A shared OT loss structure lets operators explain their exposure and lets underwriters ask better questions, in the same financial language across cyber, property, machinery breakdown, environmental and casualty lines.
Investors and lenders. For a public company the immediate question after an incident is materiality, which is why FAIR-MAM exists. For an industrial company the material losses may be regulatory penalties, mandated safety work and third-party liability years after the event, as at San Bruno, rather than the response cost in the first quarter. A loss model that stops at downtime will miss them.
Why simulation, and where the discipline goes next
Public evidence of OT losses is thin. Most incidents never disclose a figure, and many of those that do give only a same-day estimate, so every figure in our research is graded as confirmed, estimated or implied, and an amount sought in a lawsuit is never counted as a loss.
Actuarial data is just as limited. Incidents with a physical peril are rare, so there is no long loss history to fit a frequency curve to, yet the losses that do occur can be catastrophic. Simulation (aka., cyber risk quantification) is the only practical way to understand rare but catastrophic losses like these: it reasons from the controls in place, the layout of the plant and the paths an attack or accident can take, rather than waiting for a loss history that may never build up.
That evidence base will grow. As more incidents are disclosed and investigated, OT cyber risk quantification will improve as a discipline, and DeNexus will continue to be the industry pacesetter in this research and development.
Glossary
| Term | Meaning |
|---|---|
| Abundance of caution | Shutting down physical operations as a precaution during a cyber attack, before any OT asset is known to be affected |
| Cost driver | A granular cost a loss is built from, such as make-safe works or lost contribution margin; distinct from FAIR's six forms of loss |
| CRQ | Cyber risk quantification: expressing cyber risk as a financial figure |
| Direct OT compromise | An attack that impaired or mis-operated industrial control assets themselves |
| FAIR | Factor Analysis of Information Risk, published by The Open Group as Open FAIR (O-RT and O-RA) |
| FAIR-CAM | The FAIR Institute's Controls Analytics Model, describing how control functions change frequency or magnitude |
| FAIR-MAM | The FAIR Institute's Materiality Assessment Model, which expands loss magnitude into cost modules |
| Forms of loss | FAIR's six kinds of cost: productivity, response, replacement, fines and judgments, competitive advantage, reputation |
| ICS / OT | Industrial control systems / operational technology: the computers and networks that monitor and control physical processes |
| Loss Event Frequency | How often a loss event happens; threat event frequency multiplied by vulnerability |
| Loss Magnitude | How much a loss event costs when it happens |
| MITRE ATT&CK for ICS | A public catalog of attacker techniques against industrial control systems, including their impacts on the process |
| Peril | The physical event between a cyber event and its cost, such as fire, explosion or overheating |
| Primary / secondary loss | Losses borne directly by the organization / losses arising from how regulators, customers and courts react |
| Safety instrumented system (SIS) | An independent control system that takes a process to a safe state when it moves outside safe limits |
Works Cited
- Dragos, Inc., and Marsh McLennan. 2025 OT Security Financial Risk Report. Dragos, Aug. 2025, hub.dragos.com/hubfs/dragos-ot-security-financial-risk-report-august-2025.pdf.
- DeNexus. OT Cyber Incident Loss Research. Unpublished research database, DeNexus, updated 22 Oct. 2026.
- The Open Group. The Open Group Standard for Risk Taxonomy (O-RT), Version 3.0.1. Document C20A, The Open Group, Nov. 2021, pubs.opengroup.org/security/o-rt/.
- The Open Group. The Open Group Standard for Risk Analysis (O-RA), Version 2.0.1. Document C20B, The Open Group, Nov. 2021, pubs.opengroup.org/security/o-ra/.
- FAIR Institute. "Announcing a FAIR Taxonomy for Cyber Risk Scenarios." FAIR Institute Blog, 26 Feb. 2025, www.fairinstitute.org/blog/announcing-a-fair-taxonomy-for-cyber-risk-scenarios.
- FAIR Institute. A FAIR Taxonomy for Cyber Risk Scenarios: An Analyst's Guide for Defining Risk Scenarios for Continuous Risk Management. FAIR Institute, Feb. 2025.
- FAIR Institute. "FAIR Materiality Assessment Model." FAIR Institute, www.fairinstitute.org/fair-materiality-assessment-model.
- Jones, Jack. An Overview of FAIR-CAM. FAIR Institute, 2023, www.fairinstitute.org/FAIR-CAM/.
- Ginter, Andrew, et al. 2026 OT Cyber Threat Report. Waterfall Security Solutions and ICS STRIVE, 2026.
- MITRE. "ATT&CK for ICS Matrix." MITRE ATT&CK, attack.mitre.org/matrices/ics/.
- Idaho National Laboratory, CyOTE Program. Case Study: TRITON Malware Attack Against Petro Rabigh. INL/RPT-22-67981, U.S. Department of Energy, 30 June 2022, cyote.inl.gov/content/uploads/24/2025/12/CyOTE-Case-Study_TRITON.pdf.
- Cybersecurity and Infrastructure Security Agency, et al. "Compromise of U.S. Water Treatment Facility." Joint Cybersecurity Advisory AA21-042A, 11 Feb. 2021, www.cisa.gov/news-events/alerts/2021/02/11/compromise-us-water-treatment-facility.
- Bundesamt für Sicherheit in der Informationstechnik. The State of IT Security in Germany 2014 [Die Lage der IT-Sicherheit in Deutschland 2014]. BSI, Dec. 2014.
- Lee, Robert M., Michael J. Assante, and Tim Conway. "German Steel Mill Cyber Attack." SANS ICS Defense Use Case, SANS Institute, 30 Dec. 2014.
- Idaho National Laboratory, CyOTE Program. Precursor Analysis Report: Cyber Attack on Thyssenkrupp Blast Furnace 2014. INL/RPT-22-70679, U.S. Department of Energy, 31 Dec. 2022, cyote.inl.gov/content/uploads/24/2025/12/CyOTE-Case-Study_Thyssenkrupp.pdf.
- National Transportation Safety Board. Pacific Gas and Electric Company Natural Gas Transmission Pipeline Rupture and Fire, San Bruno, California, September 9, 2010. Pipeline Accident Report NTSB/PAR-11/01, 30 Aug. 2011, www.ntsb.gov/investigations/accidentreports/reports/par1101.pdf.
- PG&E Corporation. "PG&E Corporation Reports Full-Year and Fourth-Quarter 2015 Results." News release, 18 Feb. 2016, s21.q4cdn.com/673114418/files/doc_events/2016/02/1/PG-E-Corporation-Reports-Full-Year-and-Fourth-Quarter-2015-Results-F.pdf.
- California Public Utilities Commission. "CPUC Penalizes PG&E $1.6 Billion for Pipeline Violations." Press release, 9 Apr. 2015.
- "San Bruno Announces $70M Blast Settlement With PG&E." CBS San Francisco, 12 Mar. 2012, www.cbsnews.com/sanfrancisco/news/san-bruno-announces-70m-blast-settlement-with-pge.
- Associated Press. "Cyberattack Targeting Refrigeration Systems Hits 700 Supermarkets, French Government Says." NY1, 13 Oct. 2026, ny1.com/nyc/all-boroughs/ap-top-news/2026/10/13/cyberattack-targeting-refrigeration-systems-hits-700-supermarkets-french-government-says.
- CERT-FR. "Security Incident Targeting Remote Controllers of Refrigeration Installations" [Incident de sécurité ciblant les contrôleurs à distance des installations de réfrigération]. Alert CERTFR-2026-ALE-012, ANSSI, 12 Oct. 2026, updated 16 Oct. 2026, cert.cyber.gouv.fr/alerte/CERTFR-2026-ALE-012.
- Reuters. "Hackers Heat French Supermarket Fridges, Sparking Fires and Spoiling Food." Daily Maverick, 12 Oct. 2026, www.dailymaverick.co.za/article/2026-10-12-hackers-heat-french-supermarket-fridges-sparking-fires-and-spoiling-food/.
- Garoscio, Paolo. "Cyberattack on Refrigeration Systems: Millions Lost in French Supermarkets" [Cyberattaque sur les systèmes frigorifiques : des millions perdus dans les supermarchés français]. Journal de l'Économie, 12 Oct. 2026, www.journaldeleconomie.fr/cyberattaque-frigo-octobre-explications/.
- Abbott, George, and Elizabeth Howcroft. "Insurers Say French Supermarkets' Cyber Insurance Unlikely to Cover Food Losses." Carrier Management, Reuters, 20 Oct. 2026, www.carriermanagement.com/news/2026/10/20/292812.htm.