Loss outputs
From the same run as every other figure here.
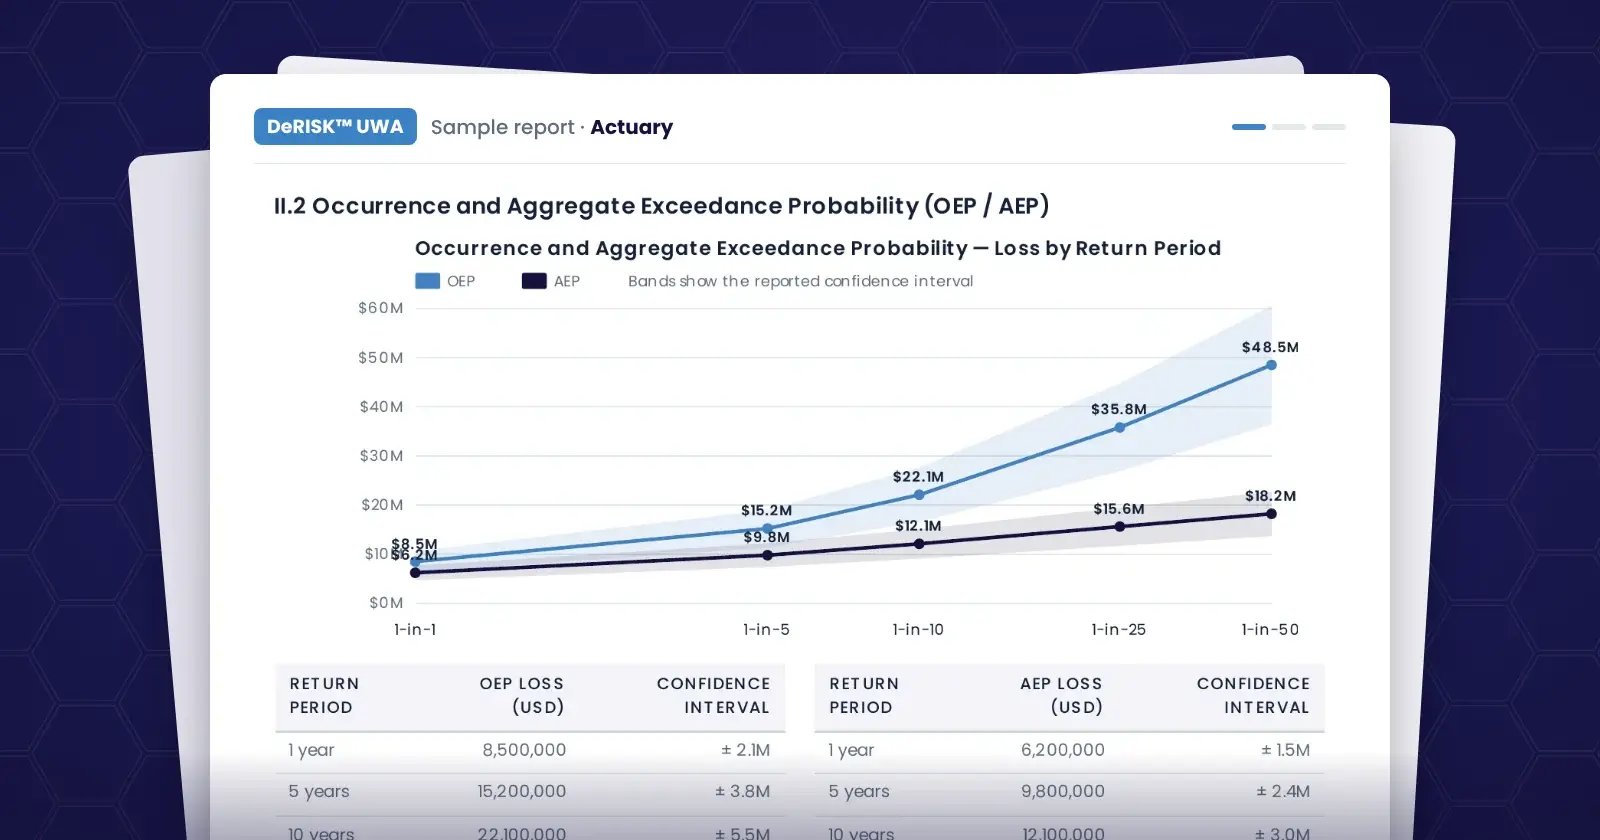
Frequency, severity and exceedance curves for each OT submission, with the assumptions written down.
Your first submission runs free on DeRISK™ UWA Standard: one document, read as it arrived, through the standard actuarial engine. It asks the applicant nothing, and a human reviews every output.
One submission document · standard actuarial engine · human review before release
One answer, as the applicant gave it, as the assessment reads it, and as it reaches your model.
Q41: Is the OT network segmented from IT? “Yes.”
Stated, not verified: it doesn’t say whether that means a VLAN, a firewall, a DMZ or something else. OT confidence 0.20.
0.35 loss events a year · 1-in-100 $2.4M · OT confidence stated
Generic views of the actuarial section of the committee-ready report, on the Professional tier. One simulated run behind every figure.
From the same run as every other figure here.
AEP sits at or above OEP at every return period: a year’s total can’t be smaller than its largest loss. With 0.35 loss events a year, the two run close: $3.9M and $4.1M at 1-in-200. Check: a 1.0% chance a year that total loss tops $2.5M, the AEP’s 1-in-100 point.
| Threat type | Events a year (frequency) | Chance of at least one a year (probability) | Average loss per event | Share of expected annual loss |
|---|---|---|---|---|
| Ransomware that reaches OT | 0.06 | 5.8% | $900K | 36% |
| Equipment damage (cyber-physical) | 0.02 | 2.0% | $1.5M | 20% |
| Data breach | 0.12 | 11.3% | $250K | 20% |
| Remote access compromise | 0.07 | 6.8% | $350K | 16% |
| Insider misuse | 0.08 | 7.7% | $150K | 8% |
| All threats | 0.35 | 29.5% | $430K | 100% |
Frequency and probability, labeled apart. Shares weight each threat’s average loss by how often it happens.
Written down in one place, before anyone relies on the output.
Every figure traces to the inputs behind it, with an attribution statement.
Your DeRISK results already hold the answer. Finding it shouldn’t take a meeting.
DeRISK Davy add-on
Davy is the voice; the score, the decision and the report come from DeRISK. Davy runs on frontier AI models, privately inside DeNexus’ own cloud environment. Guardrails at the model boundary. No training on your data. Your conversation history stays in your account, and you can delete it at any time.
Why is the 1-in-200 so far above the 1-in-100?
The tail comes from single large events: ransomware that reaches OT, and equipment damage. The 1-in-100 year OEP is $2.4M and the 1-in-200 is $3.9M.
DeRISK UWA comes with its own actuarial engine: a Monte Carlo of 100,000 simulations, with an audit trail on every run. Enterprise teams that already price on their own model can replace it and keep the OT exposure inputs that DeRISK builds.
Enterprise tier
Two ways to run the numbers
Simulation method, parameters, calibration data and assumptions, in the report.
Nothing reaches pricing without a person, and every run keeps its audit trail.
The Enterprise tier substitutes your actuarial model entirely.
Each runs in isolation, nothing trains the models, and client data is flushed after the run.
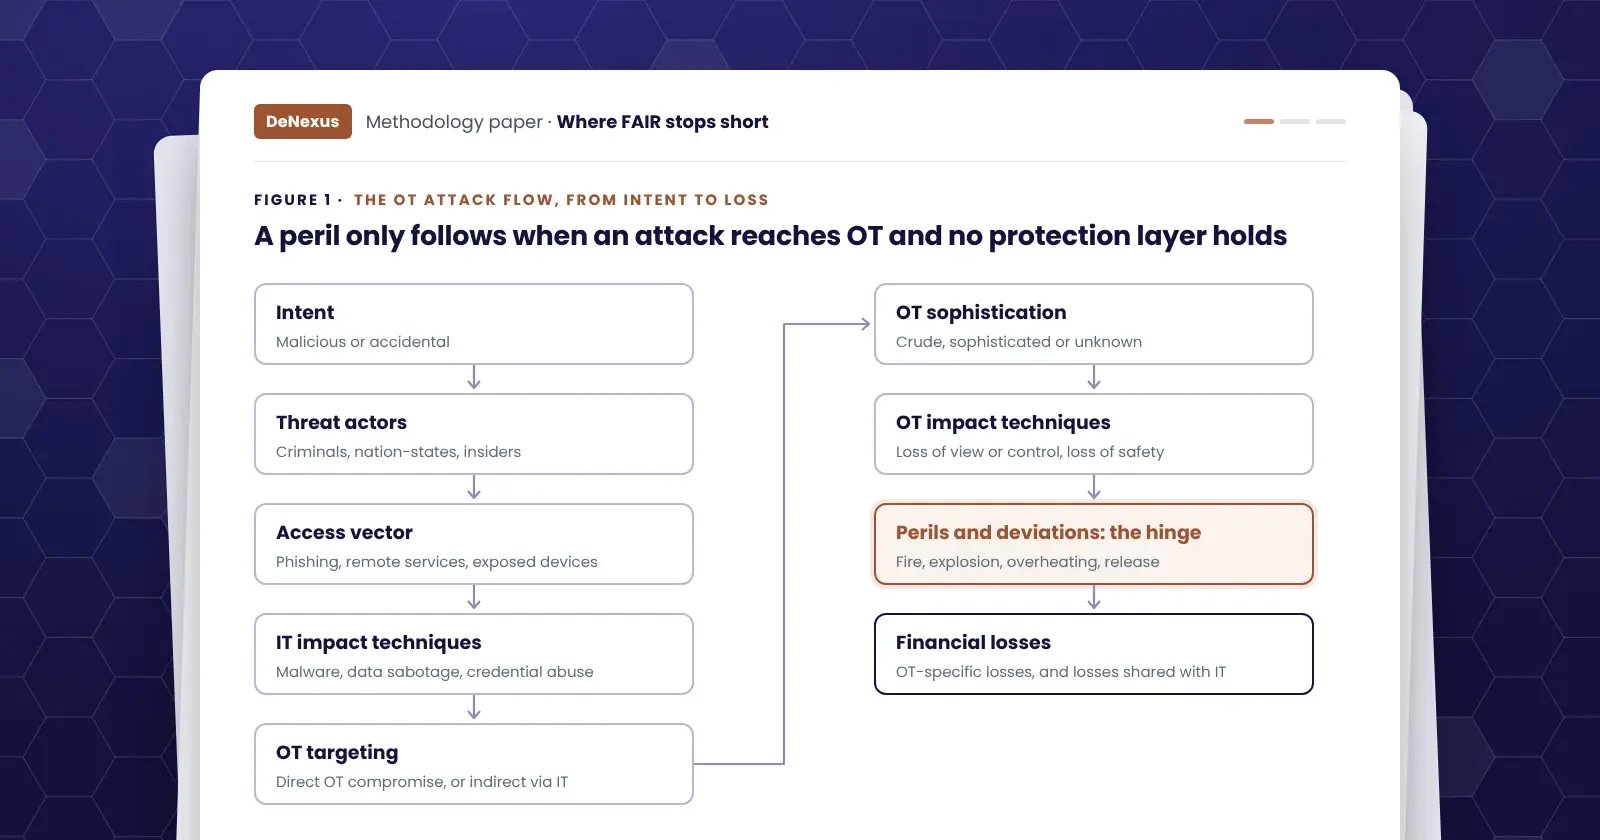
Whitepaper · 14 min readA maturity score is not a frequency. Industrial cyber-physical loss needs a distribution built from the physical process, not from breach data.
Read the paperSample report (PDF)
Methodology paper · 20 min readCreate a free account and run one submission on the Standard tier. It asks the applicant nothing, and you review every output.