Which plants carry the risk
Share of company expected annual loss. Seven more plants: $5.7M (31%).
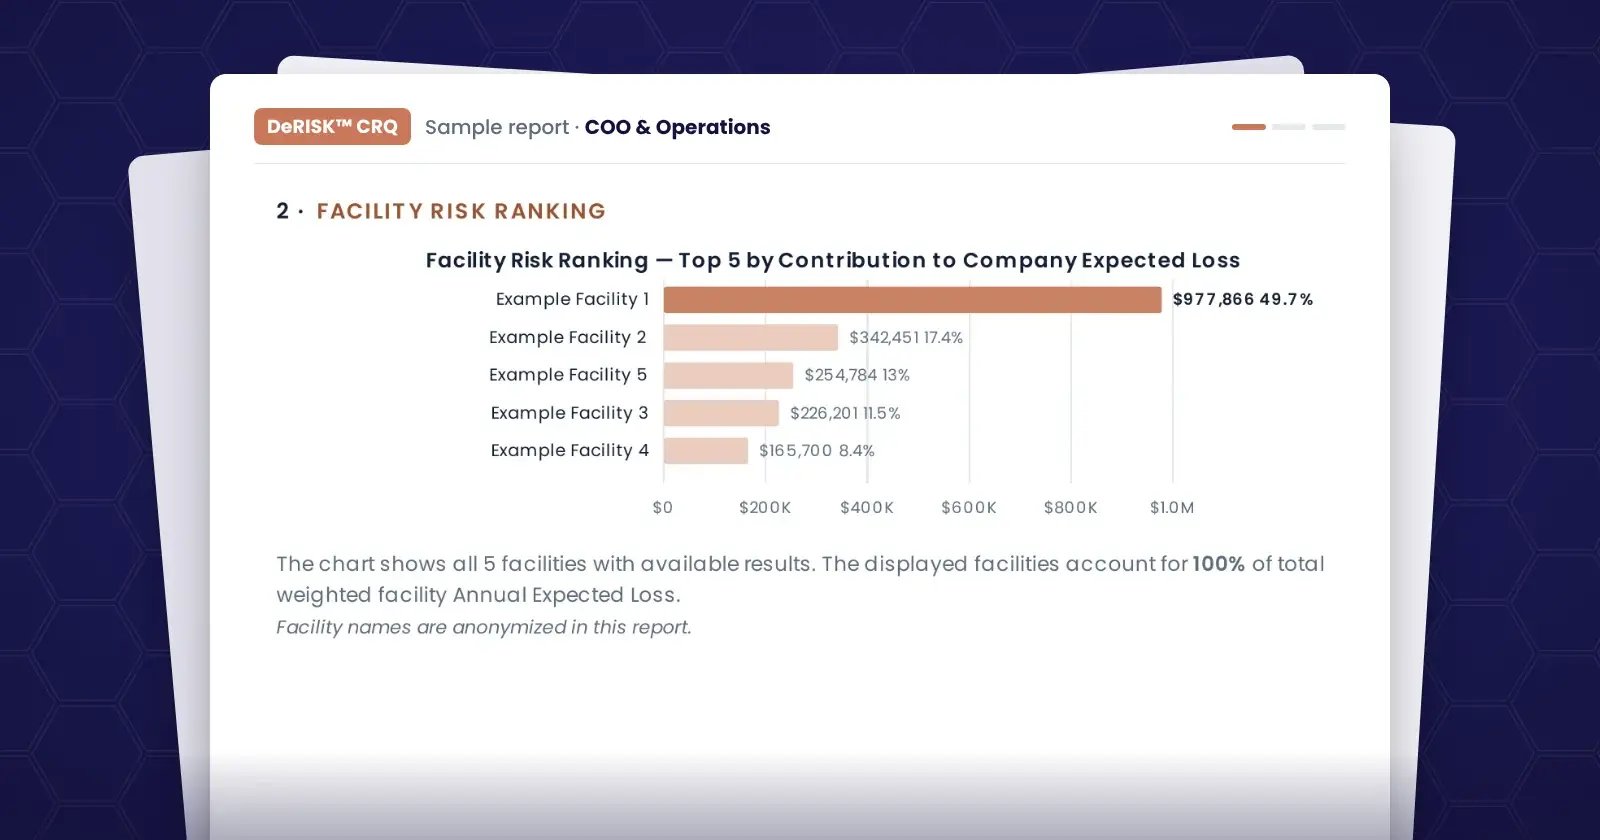
Expected annual loss and a 1-in-100 year loss for each plant, ranked, with the attack scenarios behind them.
Your first result is a DeRISK™ CRQ estimate for your company, built from public data. Plant-by-plant results start at Level 3 Board-Grade. Nothing connects to your OT network.
From public data · thousands of simulated years · assumptions and limitations listed
Share of company expected annual loss. Seven more plants: $5.7M (31%).
One plant, as the floor sees it, as operations tracks it, and as the board hears it.
A vendor’s remote access account can reach Houston’s line controls.
Houston carries more OT cyber risk than any other plant: 24% of the company’s expected loss.
$4.4M a year of the company’s $18.4M expected loss sits at Houston.
Generic views of the COO report at DeRISK CRQ Level 3 Board-Grade, plant by plant.
Share of company expected annual loss. Seven more plants: $5.7M (31%).
Two figures, both labeled: Houston’s share of company loss, and its loss on its own.
| Plant | Firewalls | Malware prevention | Vulnerabilities | Access controls | Detection | Incident response | Backups | Average |
|---|---|---|---|---|---|---|---|---|
| Houston | 1.0 | 2.0 | 1.5 | 1.5 | 2.0 | 2.0 | 1.5 | 1.6 |
| Baton Rouge | 2.0 | 2.5 | 1.5 | 2.0 | 1.5 | 2.0 | 1.5 | 1.9 |
| Chicago | 2.5 | 2.5 | 2.0 | 2.5 | 2.0 | 2.0 | 2.5 | 2.3 |
| Pittsburgh | 2.5 | 2.0 | 2.0 | 2.0 | 2.0 | 1.5 | 2.5 | 2.1 |
| Tulsa | 1.5 | 1.5 | 1.0 | 1.5 | 1.0 | 1.0 | 1.5 | 1.3 |
Scale 0 to 4; lighter is weaker. Tulsa scores weakest, but Houston carries more loss: rank by loss, not by score. Also available in IEC 62443, NIST SP 800-82r3 or the DeRISK Control Model.
Expected annual loss. The forecast follows the Consultant’s project order, not dates: DeNexus doesn’t schedule the work.
Expected annual loss by plant. Plant-by-plant results start at Level 3 Board-Grade.
Your DeRISK results already hold the answer. Finding it shouldn’t take a meeting.
DeRISK Davy add-on
Davy is the voice; the score, the decision and the report come from DeRISK. Davy runs on frontier AI models, privately inside DeNexus’ own cloud environment. Guardrails at the model boundary. No training on your data. Your conversation history stays in your account, and you can delete it at any time.
Which plant carries the most?
Houston: $4.4M a year, 24% of company expected annual loss. Baton Rouge is next at $3.2M.
Every outage window has more projects than slots. Rank the work by the loss it removes, and security earns its slot on the merits.
Add the DeRISK Consultant to get the next-best remediation projects, their scope and their order, in less than one hour. Your planners fit them into the outage windows you already have. It doesn’t price or schedule the work, so bring your own costs and dates.
DeRISK Consultant add-on
Loss removed per year, per project. Return needs your own costs.
The DeRISK Scenario Simulator is a future add-on that will let you model different OT cyber scenarios against the risk you have already quantified. It is still being defined, and we will share more as it takes shape.
DeRISK Scenario Simulator add-on · in development
The probability of a loss (frequency) and its severity (magnitude), over thousands of simulated years.
Each plant gets its own results from Level 3 Board-Grade up, so you can compare sites.
See the inputs behind each plant’s number, and overrule the ones you know better.
Level 3 Board-Grade works from public data and about 50 questions. OT network data comes in at Level 4 Evidence-Grade.
Your CISO already holds the security findings. With DeRISK CRQ, they can bring them to the operations review as dollars by plant, ranked, instead of vulnerability lists.
The Operational Resilience & Facility Risk report comes with DeRISK CRQ Level 3 Board-Grade. Anyone can start with the free estimate.
Each level replaces public-data assumptions with your own evidence, which reduces the uncertainty around your number.
 Whitepaper · 10 min read
Operations measures disruption in days, not vulnerabilities. Cyber risk has to be told in days, per plant.
Read the paperSample report (PDF)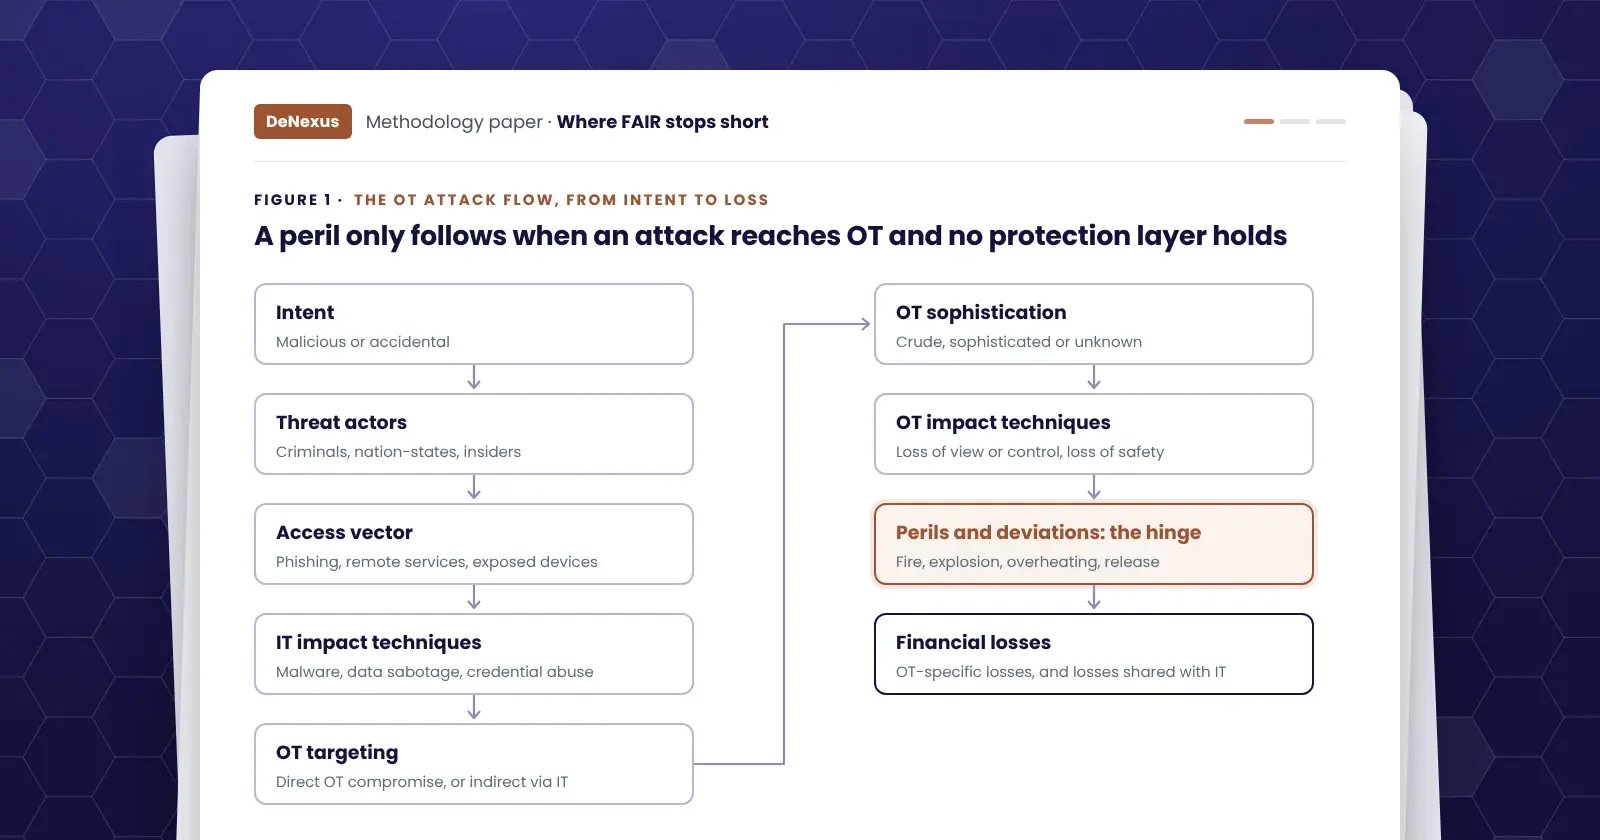 Methodology paper · 20 min read
Create a free account. Your first result is a company-level estimate from public data, so nothing touches your plants’ networks. Plant-by-plant results start at Level 3 Board-Grade.
Not the one who runs security? Send this page to your CISO.