Risk position
$18.4MExpected annual loss
$64M1-in-20 year (VaR 95th)
$112M1-in-100 year (VaR 99th)
Turn OT cyber risk into expected annual loss, a bad-year loss and the attack scenarios behind them, in the dollars your board and CFO already use.
Your first result is a DeRISK™ CRQ estimate for your company, built from public data. No questions for a public company; just annual revenue for a private one. Nothing connects to your OT network.
From public data · thousands of simulated years · assumptions and limitations listed
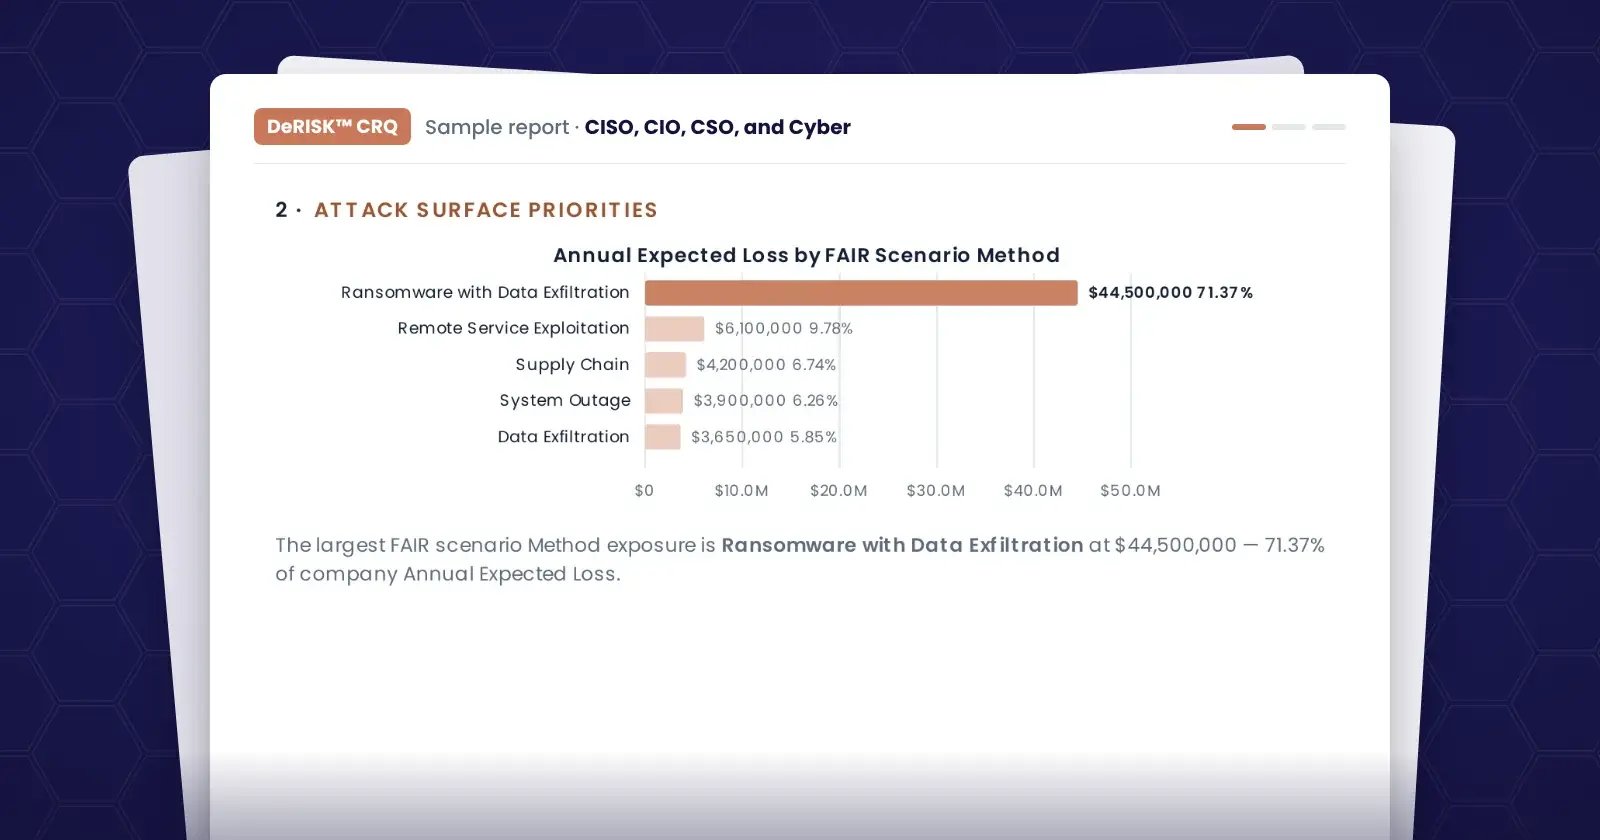
Expected annual loss by attack method.
The same gap, as the plant sees it, as you track it, and as the board needs to hear it.
The control network and the business network share one flat segment.
Ransomware can move from an email inbox to the SCADA servers.
$8.8M a year expected from ransomware. $41M in a 1-in-100 year.
Generic views of the CISO report at DeRISK CRQ Level 3 Board-Grade, for the company and site by site.
Expected annual loss by attack method.
Expected annual loss by loss type.
Overall 2.0 of 4.0, Developing. Also available in the DeRISK Control Model or IEC 62443.
Expected annual loss. The forecast follows the Consultant’s project order, not dates: DeNexus doesn’t schedule the work.
Expected annual loss by facility. Facility-scope results start at Level 3 Board-Grade.
Your DeRISK results already hold the answer. Finding it shouldn’t take a meeting.
DeRISK Davy add-on
Davy is the voice; the score, the decision and the report come from DeRISK. Davy runs on frontier AI models, privately inside DeNexus’ own cloud environment. Guardrails at the model boundary. No training on your data. Your conversation history stays in your account, and you can delete it at any time.
How much of the $18.4M comes from ransomware?
$8.8M a year, or 48% of expected annual loss. In a 1-in-100 year, ransomware alone could cost $41M.
An outage request that comes with the loss it removes is easier to weigh against the production it costs. Rank the work by loss, and the few maintenance windows you get go to what matters most.
Add the DeRISK Consultant to get the next-best remediation projects, their scope and sequence, in less than one hour, ranked by the loss each one removes. It doesn’t price the work, so bring your own project costs to compare the return.
DeRISK Consultant add-on
Loss removed per year, per project. Return needs your own costs.
The renewal questionnaire asks what changed. Show it: the projects finished since the last renewal, with the assessed drop in expected loss, and the projects planned for the year ahead, on the policy year your risk manager works to.
Assessed: $23.0M at the last renewal, $18.4M now, down $4.6M.
Forecast: $14.3M if project 1 lands before the renewal; $11.1M once all three are done.
Renewal is one date a year; risk moves all year. The dates are yours: DeNexus doesn’t schedule the work, and costs stay internal.
The DeRISK Scenario Simulator is a future add-on that will let you model different OT cyber scenarios against the risk you have already quantified. It is still being defined, and we will share more as it takes shape.
DeRISK Scenario Simulator add-on · in development
The probability of a loss (frequency) and its severity (magnitude), over thousands of simulated years.
Data sufficiency and confidence are stated with the results.
The report lists its assumptions and limitations.
See the inputs behind the number, and overrule the ones you know better.
Each level replaces public-data assumptions with your own evidence, which reduces the uncertainty around your number.
Add-ons start here
 Whitepaper · 15 min read
Rank the work by the loss it removes, and the ranking becomes the referee between IT, the plants and finance.
Read the paperSample report (PDF) Methodology paper · 20 min read
Create a free account. Your company-level estimate is built from public data, so nothing touches your OT network.