In this view
Summary
Rank OT security work by the loss it removes, and the ranking becomes the referee between IT, the plants and finance.
Most OT security programs still rank their work by severity scores and color ratings. Those measures rank findings. They don't rank what the company stands to lose, so they can't answer the three questions a CISO is held to: what do we fix first, why, and what did last year's spend buy.
Three things to take from this paper:
- A severity score measures the flaw. A color measures a feeling about it. Neither measures your exposure. Dragos rated only a small share of the OT vulnerabilities it analyzed as needing action now, and a quarter of advisories came with no fix at all.1
- OT cyber expected loss, how often an incident happens times how bad it is (frequency times magnitude), in dollars per facility, is the one unit the plant manager, the CFO and the board already use. Public evidence on OT losses is thin and actuarial data is limited, so the number comes from simulation.
- DeRISK™ CRQ's Security Posture & Remediation report ranks attack scenarios and fixes by the loss they remove, and the DeRISK Consultant add-on names the projects and their order. The return on a project is yours to calculate, with your own cost.
Where you sit
You own OT cyber risk. You don't own the plants, their budgets or their outage calendars.
That is the position most CISOs at industrial companies are in, and most arrived there from IT. In Heidrick & Struggles' 2022 survey of 327 security leaders, 71% named IT as their main career function, and only 28% had worked in industrial, manufacturing or energy companies.2 OT has moved toward you anyway. Across five editions of Fortinet's OT survey, the share of respondents naming the CISO or CSO as ultimately responsible for OT security rose from 16% to 40%.3 The budget didn't follow in the same way. In SANS's 2025 budget survey, control of the OT security budget was shared by IT and OT in 37% of organizations, held by IT in 31%, and held by the ICS/OT side in 26%.4
Three kinds of CISO read this paper. The most common are the second type.
The “Big C” CISO reports to the CEO and faces the board. The board doesn't want the program. It wants to know what the company could lose, and whether that is shrinking.
The “little c” CISO reports to another executive, most often the CIO, and sits far from the board. Nearly two thirds of CISOs still report into IT.5 They carry the same accountability for an incident as the Big C, with fewer levers: they own the risk, the boss owns the budget, and the plants own the assets. The CISO of one solar equipment maker calls it "accountability without command."6 Just over half of the CISOs in IANS Research's 2026 benchmark said their scope was no longer fully manageable.5
The CISO newly handed OT has inherited plants, people and vendors they don't know, often with no OT asset inventory, and is still finding out what they have.
Whichever one you are, the board rarely sees OT. In the World Economic Forum's 2026 outlook, only 16% of organizations with OT give their boards OT security reports.7 And the three questions you are measured on don't change with the reporting line: what do we fix first, why, and what did last year's spend buy?
What the score doesn't tell you
A severity score describes the flaw. It says nothing about which plant the flaw sits in, what process it touches, or what stops if someone exploits it. CVSS 4.0 added an optional Safety metric in 2023, and it still can't say what one plant stands to lose.8 A color rating is weaker still. A peer-reviewed study of risk matrices found that they can give very different risks the same rating, and can rank a smaller risk above a larger one.9 Red, amber and green tell the board the risk level. They never tell it how much money is at stake.
The vulnerability scanner output from an OT environment makes this worse. Thousands of findings arrive on the same scale with no sense of consequence, in plants that patch on their own clock. For many OT systems "there's no such thing as weekly or monthly maintenance windows," and vendor contracts can dictate how, when and by whom a configuration changes.10 Each plant plans its outages around its production targets, and a fix gets into one only if it fits, or if it raises reliability or output. So the question the score can't answer is the one that matters on the floor: which few fixes change what we could lose?
The board asks the same question in its own words. NACD's handbook for directors asks management to express cyber risk as probable financial loss, in the units the board uses for every other risk it oversees.11 When the answer comes back as a count of critical findings or a heat map, the conversation ends there. The plant manager and the director are asking for the same thing. The score gives it to neither.
The evidence
The figures below come from the sources CISOs already read. Each is quoted with who was asked and when, and none is merged with another.
How many findings matter
Dragos rated only 3% of the ICS vulnerabilities it analyzed in 2025 as "Now": actively exploited and reachable. It rated 71% as "Next," which network hygiene such as segmentation can mitigate, and 27% as "Never," where a fix buys little risk reduction. A quarter of advisories came with no patch or mitigation advice at all.1 Dragos sells OT security, and these figures describe the advisories it reviewed, but the shape of the finding is what matters: a few things need action now, and most of the rest are handled by architecture.
Of the ICS vulnerabilities Dragos analyzed in 2025, few needed action now
Where incidents start
Half of the incidents in SANS's 2025 survey of 330 ICS/OT professionals began with unauthorized external access, and fewer than 15% of organizations had advanced ICS-aware remote access controls.12 Across all of Dragos's incident response cases to date, 73% involved active exploitation or credential reuse of VPNs or jump hosts, and poor IT/OT segmentation appeared in 81% of its services reports.1 The way in is rarely the newest critical vulnerability on the scanner's list. It is the shared service and the remote access path.
How long recovery takes
Nearly one in five incidents in the SANS survey took more than a month to remediate.12 Dragos saw significant operational disruption in every OT ransomware case it worked in 2025, a year in which it tracked 119 ransomware groups hitting industrial organizations, up about 49% from 80.1
The direction of travel
Two trends run against each other. OT responsibility is moving to the CISO: from 16% to 40% over five editions of Fortinet's survey.3 Board alignment with CISOs is moving the other way: from 84% in 2024 to 64% in 2025, in Proofpoint's survey of more than 1,600 CISOs.13 Budgets sit in between. Security budgets grew 4% in 2025, down from 8% in 2024 and the slowest growth in five years, and more than half of CISOs had flat or shrinking budgets.14 More scope, less trust, the same money.
Two trends run against each other
What a stop costs
Two incidents from DeNexus™'s OT Losses research show the unit the board understands.15
Jaguar Land Rover shut its systems down around 1 September 2025 after detecting an attack, and vehicle production stopped. Manufacturing restarted on a phased basis from 8 October, and JLR says production only returned to normal levels by mid-November.16 17 JLR reported GBP 196 million of cyber-incident costs in its second quarter and GBP 64 million in its third, together about 1.1% of its revenue for the year, which fell 20.9% to GBP 22.9 billion.16 17 19 The Cyber Monitoring Centre modeled the loss to JLR's UK manufacturing at GBP 108 million a week over about five weeks of suspension, and put the impact across the UK economy at GBP 1.9 billion, with more than 5,000 organizations affected.18 JLR has published nothing on how the attackers got in, and the CMC says the OT impact was unclear. The plants stopped because the company shut its systems down as a precaution.
Updated 3 November 2026. Expect new information after this date to change this analysis.
Jaguar Land Rover, 2025: the stop, the restart and the cost
What it cost. Reported cyber-incident costs: GBP 196 million in the July to September quarter and GBP 64 million in the October to December quarter, together about 1.1% of the year's revenue of GBP 22.9 billion. Impact across the UK economy, as modeled by the Cyber Monitoring Centre: GBP 1.9 billion.
Norsk Hydro was hit by LockerGoga ransomware on 19 March 2019, about three months after an employee opened an infected email from a trusted customer. Hydro isolated its plants and ran them manually where it could, with staff on pen and paper and retired employees coming back to help. It paid no ransom and rebuilt from backups. Hydro puts the total cost at around NOK 800 million, about 0.5% of its 2019 revenue, and its Extruded Solutions business was running at 70 to 80% a week after the attack.20 21 Hydro recognized at least NOK 712 million of insurance compensation across 2019 and 2020.21 22
Neither company was undone by a controller. Both lost weeks of production, and both told the loss to their shareholders in money. That is the unit this paper argues for.
What it costs you
The cost of the wrong unit lands on you three times a year, and it has little to do with attackers.
It lands in the plant. You ask the plant manager to install a fix during the next planned outage. What they hear is a severity score. That outage exists to hit a production target, and every job in it has to earn its place. Your fix carries no number that says what it protects, so it cannot compete with the other work in the window. And if the fix you asked for turns out not to matter, the plant manager will remember that the next time you ask.
It lands at the budget review. When you ask for money, the CFO asks one question: what do we get for it? In Expel's 2025 survey of security and finance leaders, more than four in ten finance executives said better translation of technical risk into financial terms would help.23 Three quarters of the CISOs in Dynatrace's 2024 survey said their security tools can't produce insights that executives and boards can use to understand business risk.24 You're selling losses that didn't happen, and the tools give you nothing to price them with.
It lands in the boardroom. A director asks "are we safe?" and the honest answer is a color. The most effective CISOs in Gartner's 2020 study met with three times as many non-IT stakeholders as IT stakeholders.25 Those meetings go better with a number the other side already uses. The consequence of getting it wrong is personal, too: in 27% of enterprises whose data was encrypted by ransomware, the IT or security leadership was replaced because of the attack.26
That is the price of reporting in a unit nobody else in the building uses.
Expected loss in your units
Expected loss is two questions with numbers attached. How often does a loss event happen, and how bad is it when it does? In the language of risk quantification those are frequency and magnitude, and expected loss is the one multiplied by the other, per facility, in dollars.
Everyday words paired with the FAIR terms: probability with frequency, severity with magnitude.
How bad is it when it happens? That is the question OT programs skip. "How bad" for a plant is not a data breach. It is the production that stops, the equipment that has to be replaced or re-validated, the response and recovery, the contracts missed, the premium that moves at the next renewal, and in the worst cases the safety and environmental consequences. DeNexus built its OT loss taxonomy from how industrial incidents cost money rather than from how data breaches do: more than 40 loss types across 20+ perils and 80+ cost drivers.27 The JLR and Hydro figures above are what those loss types look like when a company reports them.
How often does an incident happen? That question has a known problem. Public evidence on OT losses is thin and actuarial data is limited. Few companies disclose what an incident cost, and fewer still disclose how it happened. Simulation is the practical way through. A model takes what is known about the company (its sector, its facilities, its revenue, its controls, its threat environment) and runs the plausible incident paths many thousands of times to produce a distribution of outcomes: an expected annual loss, and the loss in a bad year, the 1-in-20 or the 1-in-100. The result is a range with its assumptions and data sufficiency stated, and it narrows as better data about the environment comes in. As more OT incidents are disclosed with their financial impact, that evidence calibrates and validates the model. DeNexus quantification is FAIR-based, with its own implementation and OT loss taxonomy, and fills the gaps FAIR and FAIR-MAM leave in OT. The method is set out in the DeNexus methodology paper.27
Three things change once the number exists.
First, the ranking changes. Findings are ranked by the loss each one exposes, across sites, so the few that matter rise and the thousands that don't fall away. A critical CVE on a system that can't stop a line ranks below a medium one on the system that can.
Second, the conversation with the plant changes. "This fix removes this much expected loss from your plant" is a sentence a plant manager can set against a production target. It gives them a reason to make room in the next planned outage, or to justify one.
Third, the number travels. The CFO gets expected loss and bad-year loss per facility, in the units of the capital plan. The board gets one number and its trend, in the units it uses for every other risk, which is what NACD's handbook asks for.11 The insurer gets evidence it can price. You didn't translate three times. You said one thing, and each of them heard it in their own units.
One number, heard in four sets of units
The CISO says one thing. Pick an audience to see what it hears.
What DeRISK gives you
DeRISK CRQ puts the number in your hands, in the units each of your audiences uses, and keeps it current.
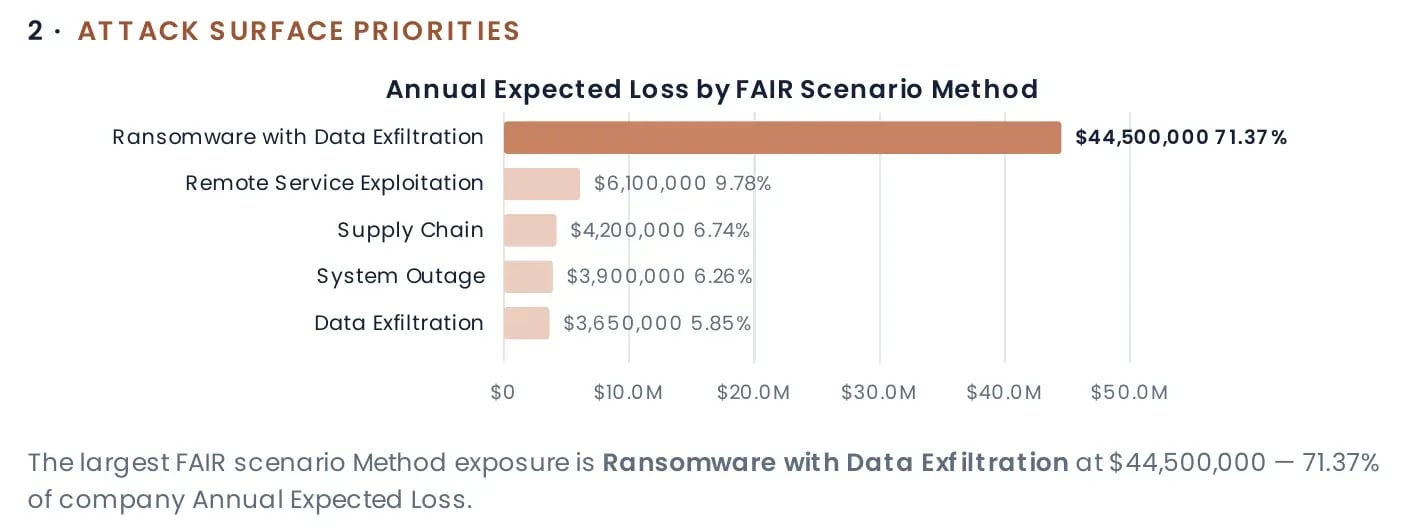
The Security Posture & Remediation report is the CISO's monthly view. It opens with your risk position: expected annual loss, the loss in a bad year, and the loss exceedance curve behind them. It shows where the risk comes in, by attack scenario and by site, and where the loss lands, by loss type. It scores your controls by NIST SP 800-82r3 or 62443-3-3 security layer, ranks the remediation portfolio by the loss each item removes, and keeps the before-and-after evidence that answers the third question, what last year's spend bought, in a budget defense summary. The method sits on the page with it: data sufficiency and confidence, the assumptions register, and the limits.
The DeRISK Consultant add-on turns the ranking into projects. It names the next-best remediation projects, their scope and their order, in less than one hour, drawing on encoded judgment from OT practitioners with decades of cumulative experience. DeRISK CRQ then calculates the loss reduction each project delivers, so the plant manager and the CFO see the scope and the number together. How much a project costs depends on how you choose to solve it, so the cost, and the return, stay yours to add.
You can start with no OT network data. The first result comes from public data about the company and a handful of questions, and it already shows expected loss, a bad year, and what drives them. A Board-Grade result adds about 50 questions, framed in the DeRISK Control Model, NIST SP 800-82r3 or IEC 62443, and brings facility-by-facility results and the role reports for your CFO, your COO, your CEO and board, and your risk manager. Evidence-Grade adds OT network data at the facility, which is where risk-based vulnerability management begins. Each step narrows the range of uncertainty in the CRQ results (see the DeNexus learn article "How certain is a CRQ result?"). When the news breaks about a peer, or a director asks "could that happen to us?", the DeRISK Scenario Simulator add-on turns the question into a number: it models the scenario, a risk-register entry or a proposed control on your own scored risk profile, so the answer comes from your plants, not from the headline. And when a director's follow-up lands in the room, DeRISK Davy, the plain-language assistant add-on, answers it from your own results, so the question is settled in the meeting and not a take-away fulfilled next quarter.
That is the referee. One number, built from your own evidence, that ranks the work, gives the plant a reason to say yes, and gives the board a figure beside every other risk it oversees. Get your first number on the CISO page at denexus.ai before the next board meeting.
Works Cited
- Dragos. OT/ICS Cybersecurity Report: 9th Annual Year in Review. Dragos, Feb. 2026, dragos.com.
- Heidrick & Struggles. 2022 Global Chief Information Security Officer (CISO) Survey. Heidrick & Struggles, 2022, heidrick.com.
- Fortinet. 2026 State of Operational Technology and Cybersecurity Report. Fortinet, 2026, fortinet.com.
- Parsons, Dean. 2025 ICS/OT Cybersecurity Budget: Spending Trends, Challenges, and the Future. SANS Institute, Feb. 2025.
- IANS Research and Artico Search. "2026 Report Finds Executive-Level CISO Titles More Prevalent than Ever." IANS, 15 Jan. 2026, ians.com.
- Farrar, Tyler. "The CISO Paradox: With Great Responsibility Comes Little or No Power." CSO Online, 13 Nov. 2024, csoonline.com.
- World Economic Forum. Global Cybersecurity Outlook 2026. World Economic Forum in collaboration with Accenture, 12 Jan. 2026, reports.weforum.org.
- Forum of Incident Response and Security Teams. "Common Vulnerability Scoring System Version 4.0: Specification Document." FIRST, Nov. 2023, first.org.
- Cox, Louis Anthony, Jr. "What's Wrong with Risk Matrices?" Risk Analysis, vol. 28, no. 2, 2008, pp. 497–512, doi.org/10.1111/j.1539-6924.2008.01030.x.
- Dragos. An Executive's Guide to Industrial Cybersecurity. Dragos, 2021.
- National Association of Corporate Directors and Internet Security Alliance. Director's Handbook on Cyber-Risk Oversight. 5th ed., NACD and ISA, 2026, nacdonline.org.
- Christopher, Jason D. State of ICS/OT Security 2025. SANS Institute, Nov. 2025, sans.org.
- Proofpoint. "Proofpoint's 2025 Voice of the CISO Report Reveals Heightened AI Risk, Record CISO Burnout, and the Persistent People Problem in Cybersecurity." Proofpoint, 26 Aug. 2025, proofpoint.com.
- IANS Research and Artico Search. "IANS Research and Artico Search Release Security Budget Benchmark Report." IANS, 5 Aug. 2025, ians.com.
- DeNexus. OT Losses. Unpublished DeNexus research, incident records for Jaguar Land Rover (2025) and Norsk Hydro (2019), 2026.
- Jaguar Land Rover. "JLR Performance Impacted in Challenging Quarter." JLR Media Newsroom, 14 Nov. 2025, media.jlr.com.
- Jaguar Land Rover. "JLR Q3 Performance Impacted by Previously Indicated Challenges." JLR Media Newsroom, 5 Feb. 2026, media.jlr.com.
- Cyber Monitoring Centre. "Cyber Monitoring Centre Statement on the Jaguar Land Rover Cyber Incident." Cyber Monitoring Centre, 22 Oct. 2025, cybermonitoringcentre.com.
- Jaguar Land Rover. "JLR Delivers Significantly Improved Q4 Performance in Challenging Year." JLR Media Newsroom, 14 May 2026, media.jlr.com.
- Norsk Hydro ASA. "Cyber-Attack on Hydro." Hydro, updated 15 May 2024, hydro.com.
- Norsk Hydro ASA. Financial Statements and Board of Directors' Report 2019. Hydro, 2020, hydro.com.
- Norsk Hydro ASA. Financial Statements and Board of Directors' Report 2020. Hydro, 2021, hydro.com.
- Expel. The CISO-CFO Disconnect: Why Security and Finance Struggle to Align on Cyber Investment. Expel, Jan. 2026, expel.com.
- Dynatrace. "Mind the Gap: Global Report Reveals Alignment Issues Between Security Teams and the C-Suite Are Exposing Organizations to Increased Cyber Risk." Dynatrace, 2 May 2024, dynatrace.com.
- Gartner. "Gartner Survey Reveals Only 12% of CISOs Are Considered 'Highly Effective.'" Gartner, 17 Sept. 2020, gartner.com.
- Sophos. The State of Ransomware in Enterprise 2025. Sophos, 2025, sophos.com.
- DeNexus. Quantifying OT Cyber Risk: Where FAIR Stops Short. DeNexus methodology paper, 2026, denexus.ai.