In this view
Summary
What you cannot show, the market prices as doubt. Walk into renewal with evidence the underwriter can price, not a questionnaire the underwriter discounts.
Insurer and broker questionnaires ask about IT. They rarely ask about the plants, so the market cannot see OT risk, and underwriters price what they cannot see as uncertainty. In studies of how actuaries, underwriters and reinsurers set premiums, all three charged more when a risk was ambiguous.1 Meanwhile the plant sits between a property policy that says no cyber and a cyber policy that says no property damage.
Three things to take from this paper:
- A questionnaire describes controls. It cannot show what a plant could lose, so it cannot earn credit for the risk quality you have built, and it cannot reveal where the wordings leave the plant uncovered.
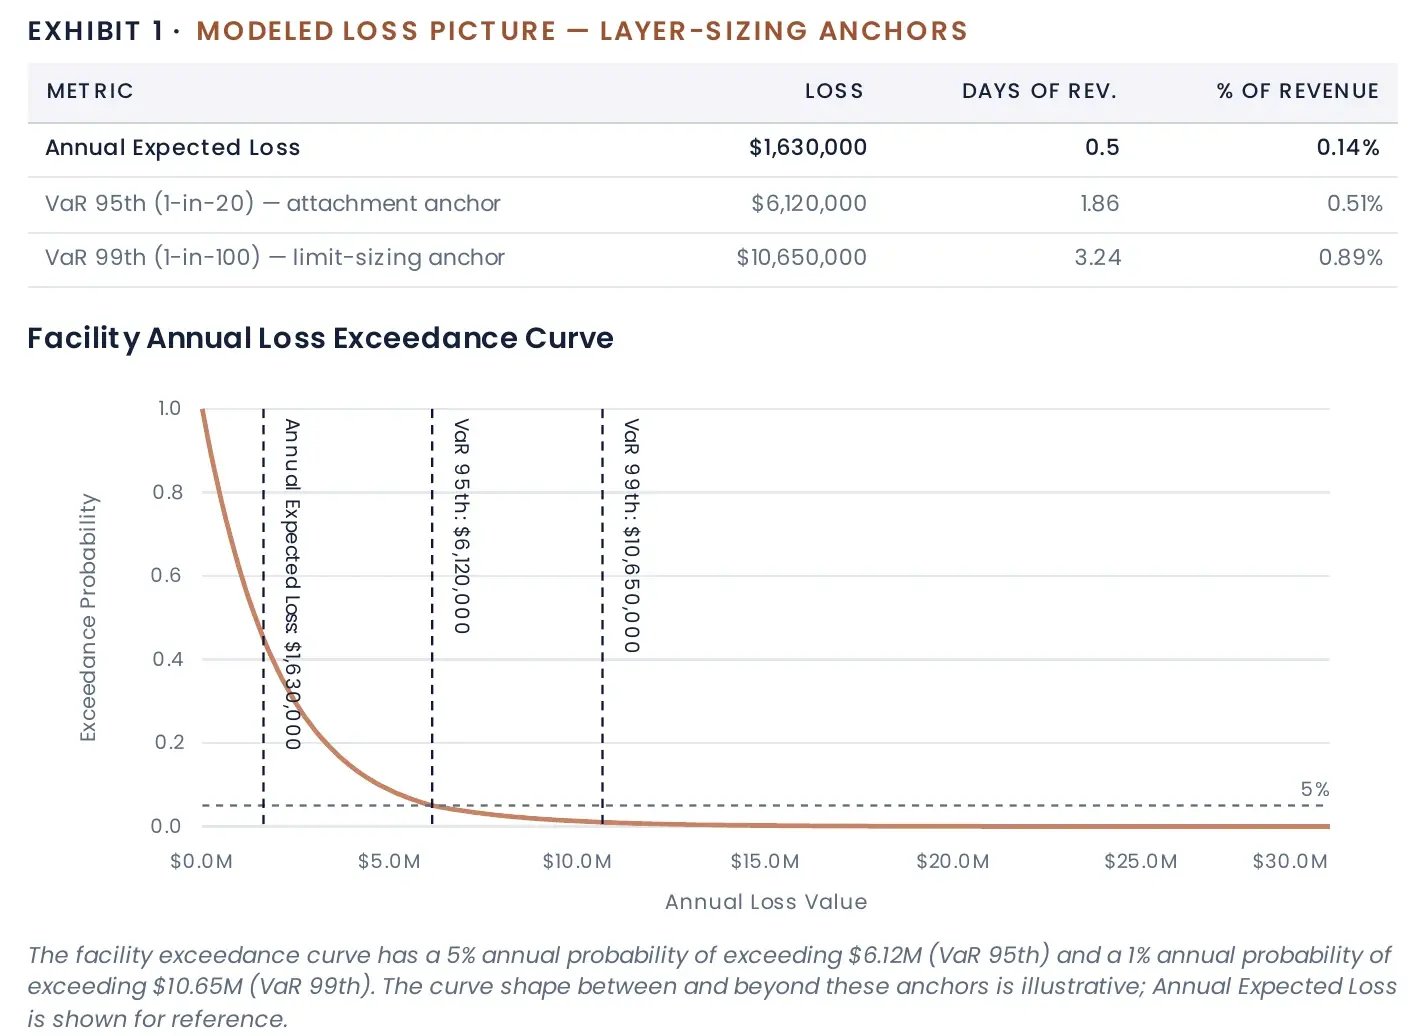
- OT cyber expected loss, how often an incident happens times how bad it is (frequency times magnitude), per facility, with the bad year, is the loss picture that sizes limits, layers and retentions, and the evidence the market prices on facts.
- DeRISK™ CRQ's Risk Transfer Evidence Bundle packages the exposure schedule, the modeled loss, the scenarios, the proof of risk quality and the record of improvement for each renewal. It is evidence to negotiate with, never a promised saving.
Where you sit
In most industrial companies the person reading this is the head of risk management and insurance. You most often report into finance, so you think in total cost of risk, and you carry more than the program: in the United States, 81% of risk managers handle insurance, 73% claims, 37% business continuity and 30% a captive.2 You own the premium. You own almost none of the controls that set it. In a 2018 survey of more than 1,300 executives, 70% named IT as a primary owner of cyber risk management, against 32% for risk management.3
You sit between everyone. The CISO owns the controls, the COO owns the business-interruption values, the CFO owns the budget, and the broker and the underwriters own the price. At renewal you need all four, and the control evidence and the interruption values usually arrive weeks before expiry. You also sit between two programs and two markets. Cyber and property are placed separately, with different underwriters and different wordings, and cyber-physical loss falls between them. European risk managers interviewed by FERMA name those gaps between traditional and cyber policies as a standing concern.4
Five kinds of risk leader read this paper. The risk manager under finance, who has to show what the premium buys and what the company keeps. The risk manager under legal, who cares what the policy will actually pay. The Chief Risk Officer reporting to the CEO or a board committee, who needs cyber in the same units as the other risks to decide how much to keep and how much to transfer. The insurance manager with a captive, who can take the first layer if they know how big it should be. And the European risk manager, whose property market keeps asking about cyber.
Whichever one you are, renewal comes once a year, and the risk moves all year.
What the questionnaire doesn't tell you
The questionnaire comes in a different format from each carrier, and you fill it in again every year. It asks about multi-factor authentication, backups, endpoint tools and incident response. It rarely asks about the plants. So the underwriter learns how your IT is run and nothing about what an industrial site could lose, and prices the gap accordingly. DeNexus™'s view, written for underwriters: a submission that cannot evidence its OT controls is a structural risk signal, not a neutral data gap.
The form hides a second problem. When nobody asks about the plants, it is easy to assume the plant losses are covered. Yet cyber policies typically exclude physical damage from cyber incidents, and organizations "may unwittingly operate with critical coverage gaps."5 And the limit itself is sized by habit: in Marsh and Microsoft's 2022 survey of more than 660 cyber risk decision makers, fewer than four in ten organizations used quantitative methods to measure their cyber exposure.6
"My CISO hands me a maturity score. My underwriter asks what a bad day costs." The questionnaire answers neither. The question it cannot answer is the one the market and the board both ask: what could this plant lose, and would the policy pay?
The evidence
Each figure below names who produced it and when, and quotes the market in its own words.
What the claims show
In Allianz Commercial's analysis of its own cyber claims, business interruption accounts for more than half of claim values.7 In the Allianz Risk Barometer 2026, cyber incidents are the top global business risk for the fifth year running, with 42% of responses, and business interruption ranks third at 29%.8 The loss the market pays most for is the one a plant stop produces.
Where the wordings leave gaps
Beazley's head of North American commercial property says property policies "typically only cover resulting fire or explosion, not direct physical damage caused by a cyber incident," unless an endorsement is added, and that waiting periods can leave the first hours or days of an outage uncovered.9 The London market's model clauses cut both ways: LMA5400 writes back fire and explosion only for non-malicious incidents, and LMA5401 excludes cyber loss outright.10 11 Lloyd's has required a state-backed cyber-attack exclusion on standalone cyber-attack policies since 31 March 2023, on the grounds that such attacks pose a systemic risk to insurers as war does.12 When DeNexus mapped one carrier's draft cyber wording against its OT loss taxonomy, nearly all OT-specific loss types went unpaid or partly paid: recall and contamination excluded, injury excluded, a bricked controller covered nowhere because "hardware" excluded industrial control systems.13 One draft wording, not a placed policy, but a pattern worth testing against your own.
What silent cyber did
PCS put NotPetya's insured loss above US$3 billion, and about 85% of it came through property policies that did not affirmatively cover cyber.14 Merck's and Mondelez's property insurers then cited war exclusions. Merck won at trial and on appeal and settled before the state's top court heard the case; Mondelez settled in 2022.15 16 17 The market's answer was to narrow the wordings, which is why the clauses above exist.
What the market is doing
In Marsh's index for the third quarter of 2026, global cyber rates fell 4%, the thirteenth straight quarterly decline, while US cyber rates were flat and global property rates fell 10%.18 One broker's 38-page cyber insurance report for 2025 does not mention energy, utilities, manufacturing, OT or industrial control systems once.19 Thirteen quarters of falling rates is the direction of travel, and a soft market hides the gap: cheaper cover still may not respond to a plant event.
Market figures updated 3 November 2026 to Marsh's third-quarter 2026 index. Expect the next quarter to change this analysis.
What one renewal looked like
Two incidents from DeNexus's OT Losses research show the two ends of the same decision.20 Norsk Hydro put the total cost of its 2019 attack at around NOK 800 million and recognized at least NOK 712 million of insurance compensation across 2019 and 2020, with AIG as lead insurer.21 22 23 Jaguar Land Rover's production was suspended for about five weeks in 2025, with GBP 196 million and GBP 64 million of cyber-incident costs in successive quarters, and the Cyber Monitoring Centre put the impact across the UK economy at GBP 1.9 billion.24 25 26 Insurance market sources told The Insurer that JLR had not finalized a cyber insurance deal when it was hit; JLR declined to comment.27
JLR figures updated 3 November 2026. Expect new information after this date to change this analysis.
One of those companies walked into its claim with a placed program and evidence. The other, by the market's account, walked into its attack mid-negotiation.
What it costs you
The missing evidence costs you four times a year, and the market collects every time.
It costs you at placement. Underwriters who cannot see the risk price the doubt, and the ambiguity studies say so plainly: actuaries, underwriters and reinsurers all set higher premiums for an ambiguous risk.1 You pay for what you could not show.
It costs you at the limit. "I can't negotiate a limit I can't justify." A limit set from last year's purchase is defended with last year's argument, and a retention set without a loss distribution is a guess the captive has to live with.
It costs you between the policies. "The property policy says no cyber. The cyber policy says no property damage. My plant sits in between." Nobody owns that gap, because cyber and property renew on different dates with different broker teams.
And it costs you the credit. The CISO closed gaps this year and the plants changed their remote access, and none of it reached the submission in a form the underwriter could price. "If we got better this year, I want credit for it." Without evidence, the market cannot give it.
Expected loss in your units
Expected loss is two questions with numbers attached. How often does a loss event happen, and how bad is it when it does? Those are frequency and magnitude, and expected loss is the one multiplied by the other, per facility. The market already thinks this way; it just cannot see the plant's answer.
"How bad" for a plant is not a data breach. It is the production that stops, the equipment replaced or re-validated, the recall, the response and recovery, the contracts missed, and in the worst cases the safety and environmental consequences. DeNexus built its OT loss taxonomy from how industrial incidents cost money rather than from how data breaches do: more than 40 loss types across 20+ perils and 80+ cost drivers, which is also the list to test a wording against.28
How often does an incident happen? That question has a known problem. Public evidence on OT losses is thin and actuarial data is limited. Few companies disclose what an incident cost, and fewer still disclose how it happened. Simulation is the practical way through. A model takes what is known about the company (its sector, its facilities, its revenue, its controls, its threat environment) and runs the plausible incident paths many thousands of times to produce a distribution of outcomes: an expected annual loss, and the loss in a bad year, the 1-in-20 or the 1-in-100. The result is a range with its assumptions and data sufficiency stated, and it narrows as better data about the environment comes in. As more OT incidents are disclosed with their financial impact, that evidence calibrates and validates the model. DeNexus quantification is FAIR-based, with its own implementation and OT loss taxonomy, and fills the gaps FAIR and FAIR-MAM leave in OT. The method is set out in the DeNexus methodology paper.28
Told as a loss picture, the number does four things at renewal.
It sizes the program. Expected loss and the bad year, per facility, give you a limit you can justify, a retention you can defend, and a first layer the captive can price. Underwriters recognize the shape, because it is the shape of their own models.
It earns the credit. Risk quality shown as evidence, and the change in modeled loss since the last renewal, is improvement the market can price. Forward commitments, stated the same way, are terms the market can hold you to.
It finds the gaps. Mapping the OT loss types to the policy language before placement shows which losses the property program would pay, which the cyber program would pay, and which neither would. In Europe, DeNexus's view is that cyber-caused fire and explosion often sits in property books, covered but unpriced; the PRA has expected insurers to identify, quantify and manage that non-affirmative cyber since 2017, and Lloyd's has required property policies to exclude cyber or cover it explicitly since 2020.29 30 The property market's questions are coming; a loss picture is the answer.
And it sets the rule for what to share. Share the risk and the improvement. Keep the project economics, the budgets and the business cases internal.
What DeRISK gives you
DeRISK CRQ turns the security program into the evidence the market prices, and keeps it current between renewals.
The Risk Transfer Evidence Bundle is five pages, built for each renewal. Exhibit A is the exposure schedule, facility by facility. Exhibit B is the modeled loss picture: expected loss and the bad year, to size limits and layers. Exhibit C is severity realism, the loss the market will believe, with the scenarios behind it. Exhibit D is the risk quality evidence underwriters look for. Exhibit E decomposes the loss into the scenarios underwriters recognize. Exhibit F is the improvement narrative since the last renewal, and Exhibit G the forward commitments the market can price. Behind them sits the method: data sufficiency and confidence, the inputs, the assumptions and the limits. A coverage translation maps the OT loss types to policy language before placement, so the gaps are found before the claim. The bundle shares risk improvement only; project costs, budgets and business cases stay inside the company.
DeRISK CRQ recalibrates as the posture changes, so the bundle reflects the company at renewal rather than at the last questionnaire. The same numbers feed the CISO's ranking, the CFO's exposure report and the board's brief, so the risk manager, finance, security and the board bring one figure to the broker.
You can start with no OT network data. The first result comes from public data about the company and a handful of questions. A Board-Grade result adds about 50 questions and brings the facility view and the bundle. Each step narrows the range the underwriter sees.
Walk into your next renewal with evidence. The first number is free, on the Chief Risk Officer page at denexus.ai, and the Underwriter view shows what the market does with the bundle once it arrives.
Works Cited
- Kunreuther, Howard, Robin Hogarth, and Jacqueline Meszaros. "Insurer Ambiguity and Market Failure." Journal of Risk and Uncertainty, vol. 7, no. 1, 1993, pp. 71–87, econpapers.repec.org.
- Tuttle, Hilary. "RIMS 2025 Compensation Survey." Risk Management, 2 Apr. 2026, rmmagazine.com.
- Marsh and Microsoft. By the Numbers: Global Cyber Risk Perception Survey. Marsh, Feb. 2018, marsh.com.
- FERMA. Demystifying Cyber Insurance: Today's Trends & Tomorrow's Challenges. Federation of European Risk Management Associations, 6 Oct. 2025, ferma.eu.
- Stubbings, Joe, and Will Slater. "Cyber-Physical Risks: Addressing Coverage Gaps in Traditional Insurance." Gallagher Specialty, 9 Oct. 2025, ajg.com.
- Marsh and Microsoft. "Increased Ransomware Attacks and Global Threats Tempering Executive Confidence in Cyber Preparedness." Press release, Marsh, 26 May 2022, via insurance-canada.ca.
- Allianz Commercial. Cyber Security Resilience 2025: Claims and Risk Management Trends. Allianz, 2025, commercial.allianz.com.
- Allianz Commercial. Allianz Risk Barometer 2026: Identifying the Major Business Risks for 2026. Allianz, 14 Jan. 2026, allianz.com.
- Beazley. Spotlight on Cyber Threats and Tech Advances 2026: Resilience in an AI-Accelerated Threat Era. Beazley, Apr. 2026, p. 24, beazley.com.
- Davison, Patrick. "Property and Marine Cyber Clauses." Bulletin LMA19-031-PD, Lloyd's Market Association, 13 Nov. 2019, lmalloyds.com.
- BMS Group. London Market Cyber Exclusions. BMS Group, Sept. 2020, bmsgroup.com.
- Chaudhry, Tony. "State Backed Cyber-Attack Exclusions." Market Bulletin Y5381, Lloyd's, 17 Aug. 2022, assets.lloyds.com.
- DeNexus. "Insurer A Cyber Wording Crosswalk." OT Losses, unpublished DeNexus research, 2026.
- PCS (Property Claim Services). "Could NotPetya's Tail Be Growing?" PCS Global Cyber, Verisk, July 2019, verisk.com.
- Merck & Co., Inc. v. ACE American Insurance Co. Docket Nos. A-1879-21 and A-1882-21, Superior Court of New Jersey, Appellate Division, 1 May 2023, via troutman.com.
- "Merck Settles Coverage Dispute with Insurers over War Exclusion in NotPetya Attack." Insurance Journal, 5 Jan. 2024, via databreaches.net.
- Perera, David. "Oreo Maker Settles with Insurer over NotPetya Damages Claim." BankInfoSecurity, 2 Nov. 2022, bankinfosecurity.com.
- Marsh. "Global Commercial Insurance Rates Fall 5% in Q3 2026; Marks Ninth Consecutive Quarterly Decline." Marsh, 21 Oct. 2026, marsh.com.
- Howden. Rebooting Growth: Howden's 2025 Cyber Insurance Report. Howden Group Holdings, 24 Sept. 2025, howdengroupholdings.com.
- DeNexus. OT Losses. Unpublished DeNexus research, incident records for Norsk Hydro (2019) and Jaguar Land Rover (2025), 2026.
- Norsk Hydro ASA. "Cyber-Attack on Hydro." Hydro, updated 15 May 2024, hydro.com.
- Norsk Hydro ASA. Financial Statements and Board of Directors' Report 2019. Hydro, 2020, hydro.com.
- Norsk Hydro ASA. Financial Statements and Board of Directors' Report 2020. Hydro, 2021, hydro.com.
- Jaguar Land Rover. "JLR Performance Impacted in Challenging Quarter." JLR Media Newsroom, 14 Nov. 2025, media.jlr.com.
- Jaguar Land Rover. "JLR Q3 Performance Impacted by Previously Indicated Challenges." JLR Media Newsroom, 5 Feb. 2026, media.jlr.com.
- Cyber Monitoring Centre. "Cyber Monitoring Centre Statement on the Jaguar Land Rover Cyber Incident." Cyber Monitoring Centre, 22 Oct. 2025, cybermonitoringcentre.com.
- Young, Sarah. "UK's Jaguar Land Rover Cyberattack Shutdown to Hit Four Weeks." Reuters, 23 Sept. 2025, via claimsjournal.com.
- DeNexus. Quantifying OT Cyber Risk: Where FAIR Stops Short. DeNexus methodology paper, 2026, denexus.ai.
- Prudential Regulation Authority. Cyber Insurance Underwriting Risk. Supervisory Statement SS4/17, Bank of England, 5 July 2017, updated 31 Dec. 2024, prarulebook.co.uk.
- Dunn, Caroline. "Providing Clarity for Lloyd's Customers on Coverage for Cyber Exposures." Market Bulletin Y5258, Lloyd's, 4 July 2019, assets.lloyds.com.