In this view
Summary
An unquantified OT cyber risk is still on your balance sheet. It is just in someone else's units. Put it in yours: expected loss, tail loss, and the loss each project removes.
Security requests arrive as a scope of work and a cost. The scope is written in technical security language, and it is driven by a framework's best practices or by the goal of reaching the next maturity level. So you decide on a project whose value you cannot see, and a price you can. No return, no ROI. In PwC's 2025 global survey of more than 4,000 executives, only 15% of organizations measured the financial impact of cyber risk to a significant extent.1 Meanwhile the losses land in a quarter with no warning, and the insurance was sized by habit.
Three things to take from this paper:
- A budget request without a loss figure cannot be compared with anything else you fund. The benefit of security is a loss that didn't happen, and nobody has been giving you that number.
- OT cyber expected loss, how often an incident happens times how bad it is (frequency times magnitude), per facility, plus the loss in a bad year, are the two numbers finance can plan with. The loss types map to lines you already track.
- DeRISK™ CRQ's Financial Exposure report states the exposure, stress-tests revenue against it, and shows the loss reduction each project delivers. You add the cost and the hurdle rate; the comparison is yours.
Where you sit
You own the numbers: reporting, capital, cash, and often risk and insurance. Four in ten US risk managers report into finance.2 Most CFOs came up through accounting, finance or banking; among the largest US companies about half majored in accounting.3 You trust a method more than a story.
Three duties put OT cyber risk on your desk whether you asked for it or not. You certify each periodic report with the CEO and must tell the auditors and the audit committee about significant control weaknesses.4 If the company is a US public company, you own the materiality clock: an 8-K within four business days of deciding an incident is material, with no numeric threshold to lean on.5 And you or your treasurer own the insurance program, its limits, retentions and premiums.
Five kinds of CFO read this paper. The CFO who has IT and the CISO in the reporting line, approving a security budget whose value they cannot see. The CFO who owns risk and insurance, sizing limits with little data. The CFO of a multi-plant industrial, deciding which plant gets the money first. The public-company CFO, who needs the number before the incident, not after. And the CFO of a leveraged or private-equity-backed company, for whom one bad quarter can trip a covenant.
Every one of those decisions needs the same number, and today none of them has it.
What the request doesn't tell you
A security budget request is a scope of work and a cost. The scope describes controls, tools and a maturity level to reach, in the language of a framework. It rarely says what the company stands to lose, or how much less it would stand to lose afterward. The benefit of security is a loss that didn't happen, which is hard to show to a CFO who wants visible returns.6 So the request is compared with nothing, approved or trimmed on judgment, and the question of what it bought never comes back around.
Insurance is sized the same way. Limits and retentions tend to follow last year's purchase, because few organizations have a loss model to size them from: only 15% measure the financial impact of cyber risk to a significant extent.1 The exclusions keep moving under the program while the limit stays where it was.
Finance has a toolkit for every other exposure: expected value, tail, stress test, reserve. "Don't give me a maturity score. Give me a number I can put in the plan." The question the request cannot answer is the one you ask of every other line: what is the exposure, and what does this spend remove from it?
The evidence
Each figure below names who produced it and when, and company losses come from the companies' own filings and statements.
What reached the P&L
Clorox's net sales fell 20% in the quarter of its August 2023 attack, to $1,386 million from $1,740 million a year earlier, after it fell back to manual ordering at a reduced rate for weeks, and it booked $57 million of incremental cyberattack costs over the following nine months, about 0.8% of a year's net sales.7 8 Merck reported that the 2017 NotPetya attack cut its sales by $260 million in 2017 and $150 million in 2018, about 0.65% and 0.35% of each year's sales.9 Norsk Hydro put the total cost of its 2019 ransomware attack at around NOK 800 million, about 0.5% of that year's revenue.10 22 Jaguar Land Rover reported GBP 196 million of cyber-incident costs in a single quarter after its production was suspended for about five weeks in 2025, and GBP 64 million more the quarter after, together about 1.1% of a year's revenue of GBP 22.9 billion.11 12 23 Insurance market sources told The Insurer that JLR had not finalized a cyber policy when it was hit; JLR declined to comment.13 These figures come from DeNexus™'s OT Losses research, which records each company's own statement.14
JLR figures updated 3 November 2026. Expect new information after this date to change this analysis.
What the market did
Across 44 extreme cyberattacks on listed companies between 2000 and 2021, shares underperformed by 8.9% after one year and 14% after two.15 Those are averages across extreme events, not a forecast for any one company.
How big the exposure is
Dragos and Marsh McLennan estimate up to US$31.1 billion as the average globally aggregated OT-related cyber risk over the next 12 months, and up to US$329.5 billion in a severe, 1-in-250-year event, from Marsh McLennan's claims data and Dragos's OT data.16 In the same model, some controls removed far more of that risk than others: an incident response plan, a defensible architecture and network monitoring each removed more than 16% on average.16
What the finance side says
Security budgets grew 4% in 2025, down from 8% in 2024 and the slowest growth in five years, and more than half of CISOs had flat or shrinking budgets.17 In Expel's 2025 survey of 164 finance leaders and 136 security leaders, more than four in ten finance executives said better translation of technical risk into financial terms would help, and four in ten said quantified risk reduction would make a bigger security budget easier to justify.18
Every one of the loss figures above was produced after the loss. The argument of this paper is that finance can have the number before.
What it costs you
The missing number costs you four times a year, and none of them is an attack.
It costs you at the budget review, where security competes with growth projects, maintenance, debt paydown and buybacks, and is the only line that cannot say what it returns. It costs you at renewal, where the limit is whatever you bought last year, while Lloyd's now requires standalone cyber-attack policies to exclude state-backed attacks19 and cyber policies typically exclude physical damage.20 A plant that burns, floods or breaks because of a cyber event may sit between two policies that each point at the other.
It costs you in the disclosure committee, where the four-business-day clock starts the moment the incident is judged material, and the judgment needs a credible loss estimate that nobody has prepared.5 And it costs you between the plants and corporate, where OT security work needs plant capital or plant downtime, neither of which sits in the security budget, so the argument over who pays is never settled on evidence.
The risk manager buys cover and the CISO buys controls, and you see two separate stories about the same exposure. "I can defend a range. I can't defend a color."
Expected loss in your units
Expected loss is two questions with numbers attached. How often does a loss event happen, and how bad is it when it does? Those are frequency and magnitude, and expected loss is the one multiplied by the other, per facility, in dollars. Finance needs "how bad" answered twice: for the expected year, and for the bad year, the 1-in-20 or 1-in-100 loss you set against revenue, earnings and the balance sheet.
"How bad" for a plant is not a data breach. It is the production that stops, the equipment replaced or re-validated, the response and recovery, the contracts missed, the recall, the premium that moves at renewal, and in the worst cases the safety and environmental consequences. DeNexus built its OT loss taxonomy from how industrial incidents cost money rather than from how data breaches do: more than 40 loss types across 20+ perils and 80+ cost drivers, most of which map to lines finance already tracks.21 The Clorox and JLR figures above are what those loss types look like in a 10-Q.
How often does an incident happen? That question has a known problem. Public evidence on OT losses is thin and actuarial data is limited. Few companies disclose what an incident cost, and fewer still disclose how it happened. Simulation is the practical way through. A model takes what is known about the company (its sector, its facilities, its revenue, its controls, its threat environment) and runs the plausible incident paths many thousands of times to produce a distribution of outcomes: an expected annual loss, and the loss in a bad year, the 1-in-20 or the 1-in-100. The result is a range with its assumptions and data sufficiency stated, and it narrows as better data about the environment comes in. As more OT incidents are disclosed with their financial impact, that evidence calibrates and validates the model. DeNexus quantification is FAIR-based, with its own implementation and OT loss taxonomy, and fills the gaps FAIR and FAIR-MAM leave in OT. The method is set out in the DeNexus methodology paper.21
Once the number exists, cyber gets the three treatments finance gives every other exposure.
Reduce. Each candidate project carries the loss reduction it delivers. You add your own cost estimate and your hurdle rate, and whether the project clears it is your comparison to make, the same way you make it for a new line or a maintenance program.
Transfer. The tail sizes the insurance program. A limit set from a 1-in-100 loss, and a retention set from what the company can absorb in a bad year, replace a limit set from last year's purchase. The same figures show where the wordings leave the plant between two policies.
Retain. What is neither reduced nor transferred is retained, knowingly, with a reserve or an appetite the board has approved. For a public company, the same exposure figures sit beside thresholds finance sets in advance, so the disclosure committee knows which scenarios could cross its line before any incident. The model informs that judgment. It never makes it.
What DeRISK gives you
DeRISK CRQ states OT cyber risk the way finance states any exposure, and gives the rest of the company the same numbers in their own units.
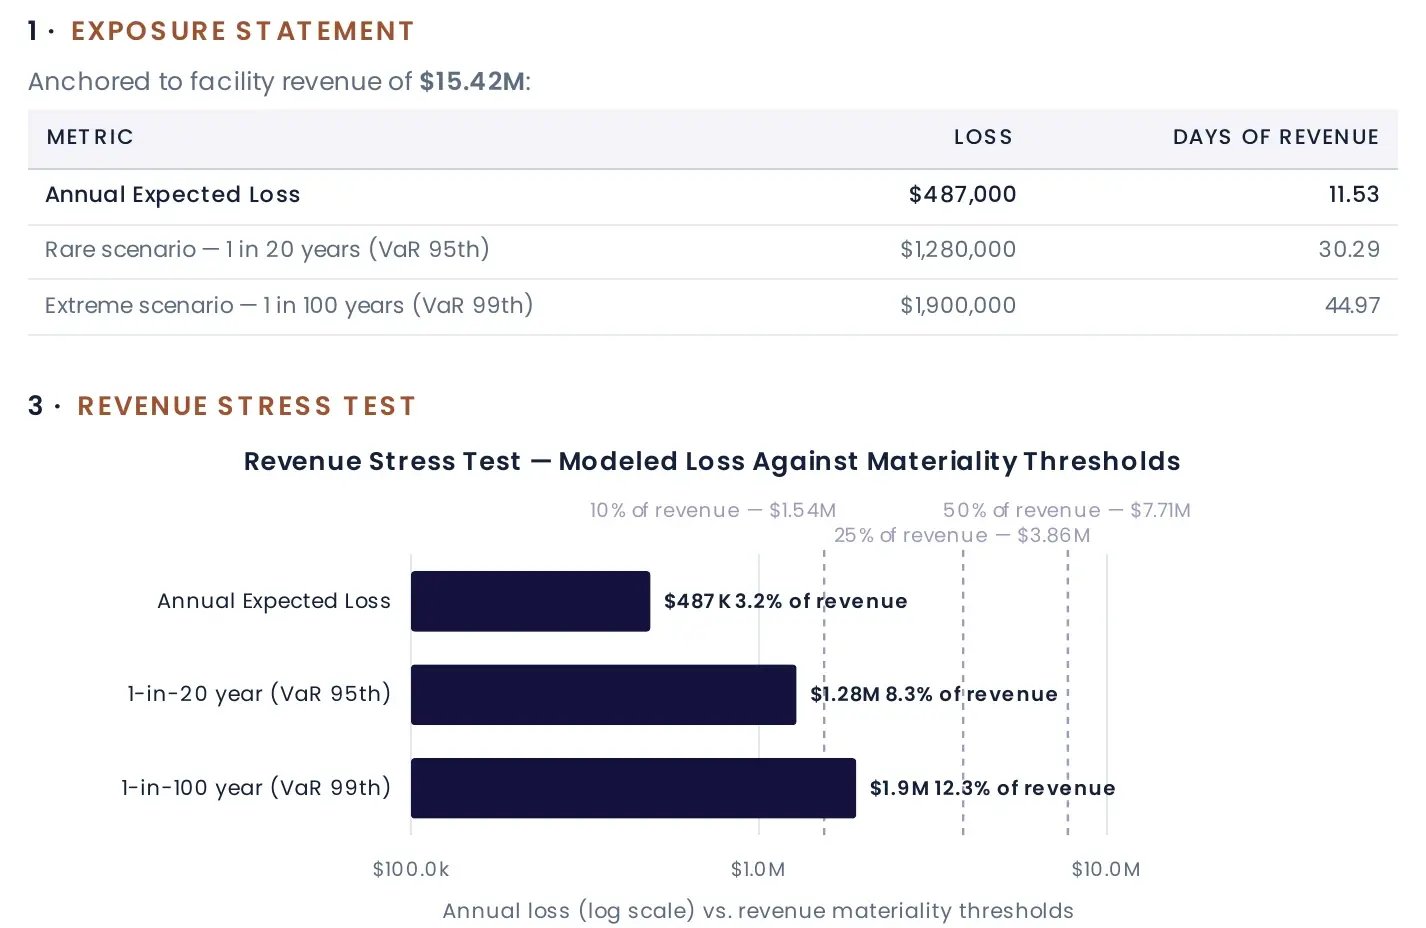
The Financial Exposure report is four pages, each quarter and at budget time. It opens with the exposure statement: expected annual loss and value at risk. It shows the tail as a loss exceedance curve, runs a revenue stress test against the bad year, and breaks the loss down by facility and by what it is made of, so you can see which lines of the P&L it would reach. For the budget cycle it carries an investment decision table and a marginal return view: the loss reduction for each candidate project, which you set against your own cost estimates and hurdle rate. It closes with a method section an auditor can follow, with inputs that can be overruled. It is an input to capital allocation; the allocation stays yours.
The same exposure feeds the Risk Transfer Evidence Bundle your risk manager takes to renewal, and the Cyber Risk Brief the board sees, so finance, risk and the board argue from one set of figures.
You can start small. The first result comes from public data about the company and fewer than ten questions. A Board-Grade result adds about 50 questions and brings the facility view and the role reports, with no OT network data needed to start. Each step narrows the range, and the report says how much data sits behind the number.
Ask your CISO for numbers you can put in the plan. If they don't have them yet, the first result is free, on the CFO page at denexus.ai.
Works Cited
- PwC. 2025 Global Digital Trust Insights. PwC, 2024, pwc.es.
- Tuttle, Hilary. "RIMS 2025 Compensation Survey." Risk Management, 2 Apr. 2026, rmmagazine.com.
- Crist Kolder Associates. Volatility Report 2025. Crist Kolder Associates, Jan. 2026, squarespace.com.
- "Corporate Responsibility for Financial Reports." United States Code, title 15, sec. 7241, Legal Information Institute, Cornell Law School, law.cornell.edu.
- U.S. Securities and Exchange Commission. "SEC Adopts Rules on Cybersecurity Risk Management, Strategy, Governance, and Incident Disclosure by Public Companies." Press release 2023-139, 26 July 2023, sec.gov.
- Egon Zehnder. "What's the Best Reporting Structure for the CISO?" Egon Zehnder, May 2018, egonzehnder.com.
- Clorox Company. Form 10-Q for the Quarterly Period Ended September 30, 2023. U.S. Securities and Exchange Commission, sec.gov.
- Clorox Company. Form 10-Q for the Quarterly Period Ended March 31, 2024. U.S. Securities and Exchange Commission, sec.gov.
- Merck & Co. "Merck Announces Fourth-Quarter and Full-Year 2018 Financial Results." Form 8-K, Exhibit 99.1, 1 Feb. 2019, sec.gov.
- Norsk Hydro ASA. "Cyber-Attack on Hydro." Hydro, updated 15 May 2024, hydro.com.
- Jaguar Land Rover. "JLR Performance Impacted in Challenging Quarter." JLR Media Newsroom, 14 Nov. 2025, media.jlr.com.
- Jaguar Land Rover. "JLR Q3 Performance Impacted by Previously Indicated Challenges." JLR Media Newsroom, 5 Feb. 2026, media.jlr.com.
- Young, Sarah. "UK's Jaguar Land Rover Cyberattack Shutdown to Hit Four Weeks." Reuters, 23 Sept. 2025, via claimsjournal.com.
- DeNexus. OT Losses. Unpublished DeNexus research, incident records for Clorox (2023), Jaguar Land Rover (2025) and Norsk Hydro (2019), 2026.
- Ryan, Matthew, Glenn Withers, and Frank den Hartog. "The Impact of Extreme Cyberattacks on Market Valuations: An In-Depth Economic Analysis." Australian Journal of Management, 2025, pp. 1–26, doi.org/10.1177/03128962251383120.
- Dragos and Marsh McLennan. 2025 OT Security Financial Risk Report. Dragos, Aug. 2025, via dragos.com.
- IANS Research and Artico Search. "IANS Research and Artico Search Release Security Budget Benchmark Report." IANS, 5 Aug. 2025, ians.com.
- Expel. The CISO-CFO Disconnect: Why Security and Finance Struggle to Align on Cyber Investment. Expel, Jan. 2026, expel.com.
- Chaudhry, Tony. "State Backed Cyber-Attack Exclusions." Market Bulletin Y5381, Lloyd's, 17 Aug. 2022, assets.lloyds.com.
- Stubbings, Joe, and Will Slater. "Cyber-Physical Risks: Addressing Coverage Gaps in Traditional Insurance." Gallagher Specialty, 9 Oct. 2025, ajg.com.
- DeNexus. Quantifying OT Cyber Risk: Where FAIR Stops Short. DeNexus methodology paper, 2026, denexus.ai.
- Norsk Hydro ASA. Financial Statements and Board of Directors' Report 2019. Hydro, 2020, hydro.com.
- Jaguar Land Rover. "JLR Delivers Significantly Improved Q4 Performance in Challenging Year." JLR Media Newsroom, 14 May 2026, media.jlr.com.