In this view
Summary
A maturity score is not a frequency. Industrial cyber-physical loss needs a distribution built from the physical process, not from breach data.
The loss data behind cyber pricing describes breaches: records exposed, systems restored, notices sent. It does not describe a plant that stops for five weeks, a furnace that cools, or a fire that starts because a safety layer was switched off. For those losses the experience is close to zero, and the question is what to build a distribution from.
Three things to take from this paper:
- Breach models were calibrated on data loss. In a public dataset of 921 cyber incidents with cost estimates, from 2005 to 2014, none of the event types covers physical damage. The mean cost, USD 7.84 million, is about 31 times the median of USD 0.25 million.1 An average cyber loss says very little.
- Cyber-physical loss has its own perils and cost drivers: stopped production, damaged equipment, re-validation, fire and explosion, injury and spills. In DeNexus™'s incident records, about two thirds of the attacks that reached OT (the systems that run the plant) ended in loss no restore or repurchase undoes. Where the attack stayed in IT, about one in twenty did.2
- A distribution can be built from the process: frequency (how often) comes from the chain of events that reaches a physical peril. Severity (how bad) comes from property and engineering experience, adjusted for a safety layer the attack may have defeated. FAIR-based simulation with an OT loss taxonomy gives frequency and severity by threat, and the exceedance curves.3 DeRISK™ UWA delivers them per risk, in your metrics.
Where you sit
You are the one who has to say whether the rate holds. The standards you work to require you to understand any model you rely on, to validate its output and to disclose that reliance.4 Under Solvency II, the actuarial function must give an opinion on the underwriting policy and on reinsurance adequacy each year. It must also make sure that any limitations in the data are properly handled, and thin data does not excuse the opinion.5
You are rarely the buyer. You are the gatekeeper: if you cannot rely on a model, it does not reach pricing, reserving or capital.
Five kinds of actuary read this paper. The pricing actuary owns rate adequacy for each risk and each class, and is pricing a refinery with a breach model. The reserving actuary owns claims development, and cyber claims keep developing after they are booked. The capital and catastrophe actuary owns the tail and the accumulation, with vendor scenarios that have no industrial theme.
The actuarial function holder must sign opinions on a book with almost no experience. The reinsurance or broker actuary prices treaties and asks, at every renewal, what in the property book is really cyber.
Across the table sits the underwriter, who is paid to write business. In a soft market you are the brake, and the relationship shows it. In hyperexponential's survey of underwriters and pricing actuaries, only 9% of actuaries called their collaboration with underwriters very effective. Another 38% cited a lack of underwriter buy-in as an obstacle.6 hyperexponential sells pricing software, so weigh the source.
The regulator adds a question of its own. The UK's insurance regulator expects insurers to find, measure and manage the cyber risk that policies neither include nor exclude.7 The market calls it "silent" cyber, and it sits in property and casualty books.
Whichever desk is yours, the question is the same: what frequency and severity do you give a loss you have almost never seen?
What the score doesn't tell you
What arrives from the security side is a maturity score, a framework result or a list of controls. A score of 3.2 out of 5 has no units. It cannot enter a frequency-severity model, and it cannot be multiplied by a limit. It tells you how mature the programme is, which is a different question from how often it fails and what the failure costs.
The data that fills the gap describes the wrong loss. The largest public dataset of its era holds 921 cyber incidents from 2005 to 2014 with cost estimates. Its event types are data breach, compromised systems, privacy violation and illicit access. None covers physical damage.
The mean cost in that dataset was USD 7.84 million and the median USD 0.25 million. So the mean is about 31 times the median, and an average cyber loss says very little.1
In the breach-era cost data, the average is 31 times the typical loss
921 incidents with public cost estimates, 2005 to 2014. Event types: data breach, compromised systems, privacy violation and illicit access. None covers physical damage.
The catastrophe models inherit the same shape. A reinsurance broker once put three leading cyber catastrophe models on one scenario and cost framework. On DeNexus's reading, that framework had no industrial scenario theme and no physical-damage cost category. The modelled global 1-in-200 loss ranged from USD 15.6 billion to 33.4 billion, depending on the model.8
The models' inputs have the same gap. Another reinsurance broker lists the exposure data fields those models consume, and none of the fields identifies a control system or a plant (DeNexus's reading).9
Three catastrophe models, one exposure set, one framework with no industrial theme
Global 1-in-200 insured loss, three models on one exposure set, 2023. The scenario framework has no industrial theme and no physical-damage cost category (DeNexus's reading).
So the score tells you the programme's maturity, and the breach data tells you the cost of lost records. Neither tells you how often this plant's safety layer fails under attack, or what a five-week stop costs.
The evidence
Each figure in this section names who produced it and when. Modellers and vendors are named as such, and DeNexus's own counts are marked as DeNexus's.
Too little history, of the wrong kind
A think-tank review of the cyber insurance market calls the lack of incident and claims data "the chief roadblock to effective cyber insurance".10 A reinsurer's own pricing guidance says the risk changes so fast that history predicts less than usual, so the actuary leans more on judgement.11 The history that does exist counts records, not production.
Big events are rare, and claims keep moving
CyberCube, a catastrophe modeller, counted more than 100 cyber events with catastrophe potential in six years. About seven became insurance events, and one, NotPetya, became a major one.12 The claims that do arrive keep developing. Later editions of the NetDiligence claims study restate past years upward, so the latest year is a floor, not a final figure (DeNexus's comparison of three editions).13
Cyber hides in property
About 85% of NotPetya's insured loss came through property policies that never said they covered cyber, by PCS's estimate.14 The war-exclusion disputes that followed ran for years. Merck won at trial and on appeal, then settled before the state's top court heard the case; Mondelez settled in 2022.15 16 17 Since January 2020, Lloyd's has required property policies to either exclude cyber or cover it in plain words.18
Where NotPetya's insured loss landed
OT reach changes the kind of loss
DeNexus counted about 40 incident records in its OT Losses research, and where the attack reached OT, about two thirds of the incidents ended in irreversible loss. Where it stayed in IT, about one in twenty did.2 Irreversible means damage no restore or repurchase undoes: equipment destroyed, people hurt or product spilled. The count is DeNexus's own, at medium confidence, and the gap holds under a stricter reading.
When the attack reaches OT, the loss changes kind
What the reported losses look like
Jaguar Land Rover shut its systems down around 1 September 2025 after detecting an attack, and vehicle production stopped for about five weeks before a phased restart.19 JLR reported GBP 196 million of cyber costs in one quarter and GBP 64 million in the next. Together that is about 1.1% of a year's revenue of GBP 22.9 billion.19 20 21
Norsk Hydro was hit by ransomware on 19 March 2019 and ran its plants by hand where it could. It puts the cost at around NOK 800 million, about 0.5% of its 2019 revenue, and recognised at least NOK 712 million of insurance compensation across 2019 and 2020.22 23 24
Updated 3 November 2026. Expect new information after this date to change this analysis.
The industrial tail is scenario-only
The Lloyd's and Cambridge "Business Blackout" scenario put insured losses from a cyber attack on the US power grid at USD 21.4 billion, and at USD 71.1 billion in its most extreme version. Both are a stress test, not a forecast.25 A 2024 study by an insurer, a reinsurer and a reinsurance broker built three extreme malware scenarios; its OT scenario was the smallest, because moving into OT is harder to automate.26 Both studies are judgement written down, not experience.
Accumulation does not diversify away
In CyberCube's model, spreading a book across geographies cuts cyber risk by at most 11% at the 1-in-25-year level, and by only 2% at 1-in-200.27 An insurer's own analysis says geography and revenue band are the wrong proxies, because accumulation follows shared technologies and vendors.28 For a plant, the shared vendor is the control system.
Growth on thin data
Howden puts global cyber premium growth at about 6% a year from 2022 to 2024, down from about 40% a year in 2020 to 2022. Its 2025 report calls its target of close to USD 20 billion by 2027 "downwardly revised". A year before, it saw close to USD 40 billion by the end of the decade.29 30
The two best-documented industrial cyber losses were told to shareholders in money, and both were production, not records. That is the loss your book carries, and the data you price from has never seen it.
What it costs you
The cost of pricing from the wrong data lands on you four times: in the opinion, in the reliance, in the rate, and in the tail.
The cost lands in the opinion. Thin data does not excuse the actuarial function from its opinions on underwriting and reinsurance.5 You sign on a book whose largest losses are production stops and damaged equipment, with data that counts records.
The cost lands in the reliance. A vendor catastrophe model is partly a black box, yet your standards require you to understand it, validate it and disclose how far you relied on it.4 Every new input faces validation, documentation and sign-off before it reaches pricing, so a better data source has a long road to travel.
The cost lands in the rate. In Marsh's index, global cyber rates fell 4% in the third quarter of 2026, the 13th quarterly fall in a row.31 Underwriters want to write the industrial account, and the rate you can defend for it rests on a breach model that has never priced a plant. Claims development makes it worse: the latest year of claims data is a floor, so the rate that looked adequate at booking is thinner a year later.
The cost lands in the tail. The 1-in-200 in your capital model has no industrial scenario in it, and the plant fire that starts with an attack sits in the property book, covered but unpriced.
The cost is a book whose largest possible loss has never been in the model.
A distribution built from the process
A cyber-physical loss is a chain of events, and each link can be given a probability. An attacker gets in, and the attack reaches OT or it does not. If it does, it reaches a physical peril or it does not: a stop, damaged equipment, a fire or explosion, a release. Frequency (how often) is the product of those links, and each link is set by the controls that stand in its way and the threat that pushes against them.
A cyber-physical loss as a chain: frequency from the links, severity after the peril
Severity (how bad) starts after the peril. A stopped line costs what a stopped line costs, and a fire costs what a fire costs; property and engineering experience already knows those numbers. One adjustment: historical severity assumes the safety layer worked, and a cyber-triggered event may have disabled it first. Hover a link for what sets it.
Severity (how bad) starts after the peril. A stopped line costs what a stopped line costs; a fire costs what a fire costs; and property and engineering experience already knows those numbers. One adjustment is needed: historical severity assumes the safety layer worked, and a cyber-triggered event may have disabled it first.
Between the peril and the money sits a consequence structure. DeNexus built it from how industrial incidents cost money rather than from how data breaches do: more than 40 loss types across 20+ perils and 80+ cost drivers.3 The JLR and Hydro figures are what those loss types look like when a company reports them.
How often does an incident happen? That question has a known problem. Public evidence on OT losses is thin and actuarial data is limited. Few companies disclose what an incident cost, and fewer still disclose how it happened. Simulation is the practical way through. A model takes what is known about the company (its sector, its facilities, its revenue, its controls, its threat environment) and runs the plausible incident paths many thousands of times to produce a distribution of outcomes: an expected annual loss, and the loss in a bad year, the 1-in-20 or the 1-in-100. The result is a range with its assumptions and data sufficiency stated, and it narrows as better data about the environment comes in. As more OT incidents are disclosed with their financial impact, that evidence calibrates and validates the model. DeNexus quantification is FAIR-based, with its own implementation and OT loss taxonomy, and fills the gaps FAIR and FAIR-MAM leave in OT. The method is set out in the DeNexus methodology paper.3
The output is a distribution, not a point. For each risk it gives the expected annual loss, the value at risk, the exceedance curves per occurrence and per year, and the maximum foreseeable loss. The assumptions, the confidence and the limits are written beside them.
Two things it is not. It is not a portfolio or accumulation model; it assesses one risk at a time, and it informs your catastrophe model rather than replacing it. And it is not experience. For cyber-caused physical loss, experience is close to zero, and simulation is the practical way to see a rare, severe loss.
The calibration is said plainly. It rests on licensed third-party industry loss data, which is mostly IT-driven, and on DeNexus's in-house OT incident and engineering research. Neither is presented as primary.
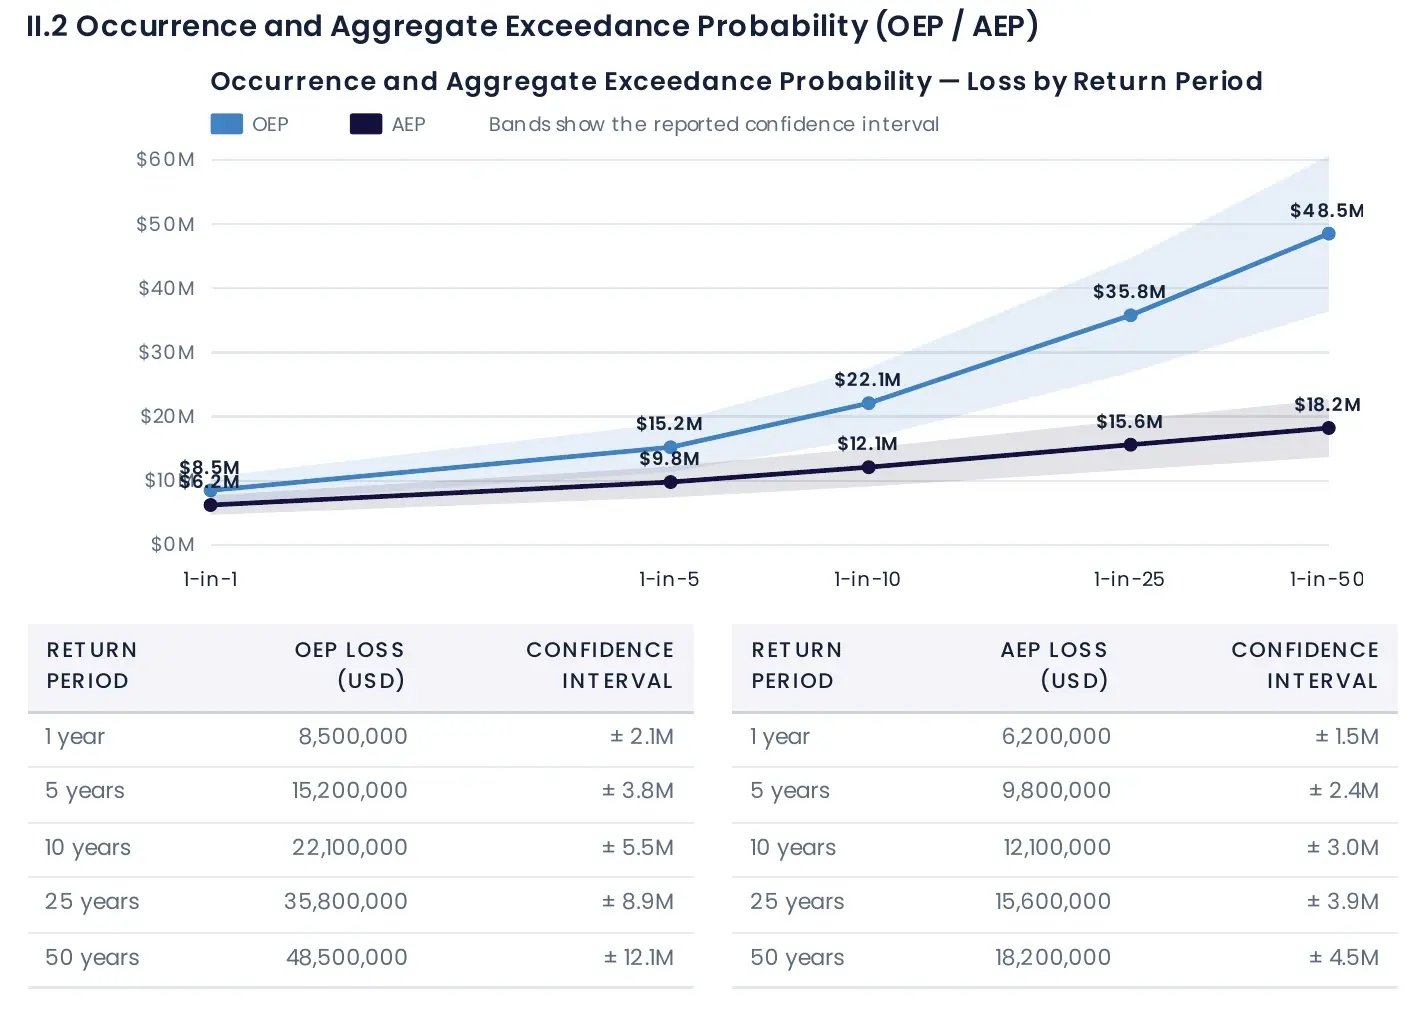
What DeRISK gives you
DeRISK UWA gives you per-risk loss outputs built for OT, with the method and the evidence chain you need to rely on them.
The outputs are in your metrics. For each submission: the expected annual loss, the value at risk, the occurrence and annual exceedance curves, and the maximum foreseeable loss. They come from a Monte Carlo engine that runs 100,000 simulations with a fixed seed, so the same inputs give the same outputs on every run. Every run carries a full audit trail and an attribution statement, and a human reviews every assessment before it reaches you.
You can see how far to trust each input. The confidence score is built from data completeness, document coverage, the OT disclosure rate and the threat-intelligence match. It separates the controls the applicant stated from the controls the evidence verified, and it scores IT and OT separately.
You can use your own model. At the Enterprise tier, your actuarial model replaces DeNexus's engine entirely: your pricing model, DeNexus's risk intelligence. For validation, the assessment also shows the risk against its class, with the premium built from a base rate and the maturity, OT and loss adjustments shown one by one. That is the individual risk rating you already do, with the adjustments visible.32
For cyber hiding in a property book, DeRISK UWA-CP takes the same chain to the property rate. The frequency of a cyber-triggered peril comes from the chain. The severity given that peril comes from property loss experience. The product is a cyber loading on the property rate, priced in your own model.
"It's simulated, not experienced." For cyber-caused physical loss, experience is close to zero. Simulation is the practical way to see a rare, severe loss, and the output is a distribution with a stated confidence, not a point. "Accumulation is what kills us." Agreed. DeRISK UWA assesses individual risks; it informs your catastrophe model and does not replace it.
Show me your assumptions before you show me your curve. The Actuary page at denexus.ai has a sample assessment with the method beside the curve.
Works Cited
- Romanosky, Sasha. "Examining the Costs and Causes of Cyber Incidents." Journal of Cybersecurity, vol. 2, no. 2, 2016, pp. 121–135, as tabulated in Swiss Re Institute, Cyber: Getting to Grips with a Complex Risk, sigma no. 1/2017, table 2.
- DeNexus. "Reachability versus Loss Class." OT Losses, unpublished DeNexus research, Sept. 2026.
- DeNexus. Quantifying OT Cyber Risk: Where FAIR Stops Short. DeNexus methodology paper, 2026, denexus.ai.
- Actuarial Standards Board. Actuarial Standard of Practice No. 56: Modeling. Doc. no. 195, Dec. 2019, actuarialstandardsboard.org.
- European Insurance and Occupational Pensions Authority. "Article 272: Actuarial Function." Commission Delegated Regulation (EU) 2015/35, Solvency II Single Rulebook, eiopa.europa.eu.
- hyperexponential. 2025 State of Pricing. hyperexponential, Nov. 2025, as reported in "Underwriter, Actuary Fears of AI Drop; Work Needed on Collaboration," Insurance Journal, 24 Dec. 2025, insurancejournal.com.
- Prudential Regulation Authority. Cyber Insurance Underwriting Risk. Supervisory Statement SS4/17, Bank of England, 5 July 2017, updated 31 Dec. 2024, prarulebook.co.uk.
- Guy Carpenter. Through the Looking Glass: Interrogating the Key Numbers Behind Today's Cyber Market. Guy Carpenter, May 2023, guycarp.com.
- Gallagher Re. Evaluating Cyber Models. Cyber IQ, 3rd ed., Gallagher Re, Nov. 2022.
- Hanson, Alphaeus. "The Role of Data in Improving Cyber Insurance Pricing." Atlantic Council, 13 Nov. 2024, atlanticcouncil.org.
- Egan, Rory. "Pricing Cyber Risk." Munich Re, 2018, munichre.com.
- CyberCube. Cyber Attack Event Analysis: Reflecting Trends in CyberCube's Portfolio Manager Version 5. CyberCube, June 2023, via cybcube.com.
- NetDiligence. Cyber Claims Study. 2024, 2025 and 2026 editions, NetDiligence.
- PCS (Property Claim Services). "Could NotPetya's Tail Be Growing?" PCS Global Cyber, Verisk, July 2019, verisk.com.
- Merck & Co., Inc. v. ACE American Insurance Co. Docket Nos. A-1879-21 and A-1882-21, Superior Court of New Jersey, Appellate Division, 1 May 2023, via troutman.com.
- "Merck Settles Coverage Dispute with Insurers over War Exclusion in NotPetya Attack." Insurance Journal, 5 Jan. 2024, via databreaches.net.
- Perera, David. "Oreo Maker Settles with Insurer over NotPetya Damages Claim." BankInfoSecurity, 2 Nov. 2022, bankinfosecurity.com.
- Dunn, Caroline. "Providing Clarity for Lloyd's Customers on Coverage for Cyber Exposures." Market Bulletin Y5258, Lloyd's, 4 July 2019, assets.lloyds.com.
- Jaguar Land Rover. "JLR Performance Impacted in Challenging Quarter." JLR Media Newsroom, 14 Nov. 2025, media.jlr.com.
- Jaguar Land Rover. "JLR Q3 Performance Impacted by Previously Indicated Challenges." JLR Media Newsroom, 5 Feb. 2026, media.jlr.com.
- Jaguar Land Rover. "JLR Delivers Significantly Improved Q4 Performance in Challenging Year." JLR Media Newsroom, 14 May 2026, media.jlr.com.
- Norsk Hydro ASA. "Cyber-Attack on Hydro." Hydro, updated 15 May 2024, hydro.com.
- Norsk Hydro ASA. Financial Statements and Board of Directors' Report 2019. Hydro, 2020, hydro.com.
- Norsk Hydro ASA. Financial Statements and Board of Directors' Report 2020. Hydro, 2021, hydro.com.
- Lloyd's and University of Cambridge Centre for Risk Studies. Business Blackout: The Insurance Implications of a Cyber Attack on the US Power Grid. Emerging Risk Report, Lloyd's, July 2015, via lloyds.com.
- Beazley, Gallagher Re and Munich Re. Cyber Realistic Disaster Scenario Development and Modelling: Triple Threat, a New Malware Model for Systemic Cyber Insurance Industry Losses. Oct. 2024, beazley.com.
- CyberCube. Reducing Cyber Catastrophe Risk: Diversification and Mitigation in Action. CyberCube, Sept. 2025, cybcube.com.
- Hervé-Mignucci, Morgan. "The Art (and Peril) of Modeling Catastrophic Cyber Risk." Coalition, 21 June 2023, coalitioninc.com.
- Howden. Rebooting Growth: Howden's 2025 Cyber Insurance Report. Howden Group Holdings, 24 Sept. 2025, howdengroupholdings.com.
- Howden. Cyber Insurance: Risk, Resilience and Relevance. Howden Group Holdings, 24 June 2024, howdengroupholdings.com.
- Marsh. "Global Commercial Insurance Rates Fall 5% in Q3 2026; Marks Ninth Consecutive Quarterly Decline." Marsh, 21 Oct. 2026, marsh.com.
- Sherwood, Margaret Tiller. "Individual Risk Rating." Foundations of Casualty Actuarial Science, 4th ed., Casualty Actuarial Society, 2001, pp. 159–196, casact.org.