What Is the FAIR Model? A Plain-Language Guide

On this page
Most cyber risk reports end in a color. Red, amber, green. High, medium, low. A board cannot add up three "highs," compare them to a budget, or buy insurance against them.
The FAIR model was built to fix that. FAIR stands for Factor Analysis of Information Risk. It measures risk in money: how often a loss is likely to happen, and how much it is likely to cost when it does.[1] FAIR calls these two things frequency (how often) and magnitude (severity).
FAIR is a widely used model for cyber risk quantification (CRQ). Its owners describe it as the only international standard quantitative model for information security and operational risk.[2] If you see a CRQ result in dollars, there is a good chance FAIR sits underneath it.
This article explains FAIR at a high level. It covers what FAIR is, how the model works, what it produces, and what it is used for. It also covers two add-on models from the FAIR Institute: FAIR-MAM, which details the cost of a loss, and FAIR-CAM, which explains how controls reduce risk.
What FAIR is
FAIR is a model of the factors that drive risk. It is a taxonomy (a set of defined terms) and an ontology (how those terms relate to each other).[1] It is the measuring tool that a risk management program uses, alongside its control checklists.
FAIR works alongside the frameworks most security teams already use. NIST, ISO and others tell organizations to assess risk, but most leave the math to the practitioner.[2] FAIR supplies that math. NIST lists FAIR as an Informative Reference to the NIST Cybersecurity Framework, mapped to its risk assessment outcomes.[3]
Two organizations publish FAIR material. The FAIR Institute is a non-profit that promotes FAIR practice, education and research. It also publishes add-on standards such as FAIR-MAM and FAIR-CAM.[2] The Open Group publishes the core model as the Open FAIR standards, the Risk Taxonomy (O-RT) and Risk Analysis (O-RA).[4] The two are licensed and organized differently. This article covers the FAIR Institute's material. Our companion article, What Is Open FAIR?, covers The Open Group's standards.
How the FAIR model works
FAIR defines risk as the probable frequency and probable magnitude of future loss.[1] Everything else in the model breaks those two parts into smaller factors that are easier to estimate.
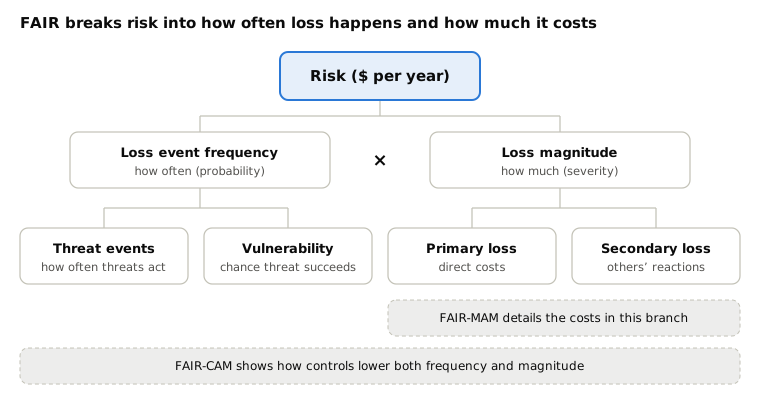
Risk sits at the top. Each level below breaks a factor into parts that are easier to estimate. The two add-on models plug into specific branches.
Loss event frequency (how often). How often, in a year, is a threat likely to cause a loss? FAIR splits this into two questions:
- Threat event frequency: how often a threat acts against the asset. A phishing campaign, a ransomware event, or an insider mistake are all threat events.
- Vulnerability (susceptibility): the chance that a threat event becomes a loss event. This depends on the attacker's capability compared with the strength of the defenses (or lack of safeguards).
Loss magnitude (severity). When a loss event happens, how much does it cost? FAIR splits this into:
- Primary loss: costs the organization bears directly, such as incident response, lost productivity, and replacing damaged assets.
- Secondary loss: costs that come from reactions of others, such as regulators, customers, lawyers and the market. Fines, lawsuits and reputation damage live here.
FAIR also sorts every cost into six forms of loss: productivity, response, replacement, fines and judgments, competitive advantage, and reputation.[2] Using the same buckets every time makes one analysis comparable with the next.
The model works top-down or bottom-up. If you have good data at a high level, such as how often ransomware has hit similar companies, you can estimate there. If you don't, you go one level down and estimate the smaller factors instead.
Start with a clear scenario
FAIR measures specific loss scenarios, then adds them up. A vague statement such as "the risk of a cyberattack" cannot be measured. A precise one can (e.g., a ransomware actor encrypts a plant's production servers through a phishing email, stopping production for several days).
The FAIR Institute's Taxonomy for Cyber Risk Scenarios gives a standard way to write one. Each scenario names four things:[5]
| Element | Question it answers | Example |
|---|---|---|
| Threat | Who or what causes the harm? | Cybercriminals, nation-state actors, insiders |
| Asset | What is affected? | Company funds, customer data, a production line |
| Method | How does the harm happen? | Phishing, ransomware, supply chain compromise |
| Effect | What kind of loss results? | Fraud, business interruption, reputation damage |
The scenario then reads as one sentence: [Threat] impacts [asset] via [method], causing [effect]. For example: a cybercriminal impacts company funds via business email compromise, causing direct financial loss.[5]
Clear scenarios matter for two reasons. They keep risk registers from filling up with overlapping or vague entries. And they give security, risk and finance teams the same words for the same thing.
What a FAIR analysis produces
FAIR produces a range of possible outcomes and how likely each one is.
That is because the inputs are ranges too. Analysts estimate each factor as a minimum, a most likely value and a maximum. Software then runs a Monte Carlo simulation: it plays out thousands of possible years, drawing different values each time. The result is a distribution of possible annual losses.
A typical FAIR report includes these outputs:[6]
| Output | What it tells you | Typical use |
|---|---|---|
| Annualized loss exposure | The expected loss per year from a scenario, combining frequency and magnitude | Ranking scenarios; budget planning |
| Loss event frequency | How often the loss is expected each year. A value of 0.1 means about once every ten years | Spotting rare but severe scenarios |
| Loss magnitude per event | What one event is likely to cost, as a range | Incident planning; insurance limits |
| Percentile range | For example, the 10th to 90th percentile: an 80% chance the annual loss falls in this band | Communicating uncertainty honestly |
| Most likely and maximum | The most common simulated result, and the worst simulated result | Separating the probable from the possible |
| Loss exceedance curve | The chance that losses will exceed any given amount in a year | Risk appetite, insurance and capital decisions |
The loss exceedance curve is often the most useful picture. Read across from a dollar amount to see the chance of losing more than that in a year. Leaders can then compare the curve to how much loss the organization is willing to accept. Supporting the conversation, "If the event occurred, how would we pay for it?", which naturally leads to discussions on how to reduce the loss.
The percentiles also help readers avoid two common traps. The average can be pulled up by a few extreme results. The maximum is possible, but rarely probable.[6] Good FAIR reporting shows both the likely range and the tail.
Add-on 1: FAIR-MAM adds detail to loss magnitude
The core FAIR model tells you what kinds of loss to count. It does not give a detailed list of the costs inside each one. The FAIR Materiality Assessment Model (FAIR-MAM) fills in that detail.[7]
FAIR-MAM expands only the magnitude (severity) side of FAIR. It does not change how frequency is estimated. Its results plug straight into a FAIR analysis.
The model groups costs into ten modules, aligned with common cyber insurance claim categories:[7]
- Information privacy
- Proprietary data loss
- Business interruption
- Cyber extortion
- Network security
- Financial fraud
- Media content
- Hardware bricking
- Post-breach security improvements
- Reputational damage
Each module holds more specific cost categories. Each category is tagged as a primary or secondary cost and linked back to FAIR's forms of loss. The design goal is that every cost has exactly one home: no gaps, no double counting.[7]
The U.S. Securities and Exchange Commission's cyber disclosure rules drove its creation. Public companies must disclose a material cyber incident within four business days of deciding it is material. The SEC gives no formula for "material."[7] FAIR-MAM gives companies a repeatable, comparable way to estimate the cost of an incident, both before and after it happens.
Typical FAIR-MAM uses include:[7]
- Estimating the cost of top risk scenarios before an incident
- Checking whether cyber insurance covers the costs that matter most
- Tracking an incident's growing cost against a materiality threshold
- Showing how costs spread across the multi-year life of an incident
Add-on 2: FAIR-CAM explains how controls reduce risk
Most control frameworks are lists. They say which controls you should have. They do not say how much risk each control removes, alone or working with others. The FAIR Controls Analytics Model (FAIR-CAM) addresses that gap.[8]
The FAIR Institute compares it to medicine. A control framework is like anatomy: a list of body parts. FAIR-CAM is like physiology: how the parts work together.[8] FAIR-CAM works alongside the control frameworks you already use.
FAIR-CAM starts by separating a control from its functions. Awareness training is a control. Helping staff recognize phishing is one of its functions. Each function is measured in its own unit, such as frequency, probability or time, instead of a 1-to-5 score.[9]
It groups those functions into three domains:[8]
| Domain | What it does | Example controls |
|---|---|---|
| Loss event | Directly lowers how often loss happens or how much it costs, through prevention, detection and response | Authentication, monitoring, incident response, backups |
| Variance management | Keeps other controls working as intended over time | Change management, patching, auditing, scanning |
| Decision support | Helps people make well-informed choices about risk | Asset management, threat intelligence, risk analysis |
This structure captures something a checklist misses. A control that never touches an attacker, such as asset management, can still reduce risk by making other controls work better. FAIR-CAM also models dependencies. For example, detecting an attack only helps if someone can see the activity, review it and recognize it as abnormal.[9]
The result: you can estimate how much a control investment reduces frequency (how often) and magnitude (severity), in the same dollar terms as the rest of the FAIR analysis. That is what lets leaders compare a control project against its cost.
What organizations use FAIR for
FAIR answers business questions in business terms. Common uses include:[2][7]
- Prioritizing risk. Rank scenarios by expected loss in dollars. Focus people and money on the few scenarios that drive most of the exposure.
- Justifying security investment. Compare the risk reduction from a project to what it costs. Show return on investment in dollars.
- Comparing options. Model "before" and "after" for two or three choices and pick the one that removes the most risk per dollar.
- Setting risk appetite. Express how much annual loss the organization will accept, then check the loss exceedance curve against it.
- Insurance decisions. Check whether limits, retentions and coverage match the losses the business actually faces.
- Board and regulatory reporting. Give directors and regulators a defensible, comparable view of cyber exposure, including materiality.
- Speaking one language. Give security, risk, finance and executive teams the same definitions, so a "high risk" means the same thing to everyone.
The common thread is decisions. FAIR is most valuable when someone has to choose between options and needs to know what each choice is worth.
Why FAIR is a trusted foundation for CRQ
A risk number is only useful if people believe it. FAIR earns that trust in four ways.
- It is open. The model, its terms and its add-ons are published. Anyone can read how a result was built and challenge any input.
- It is consistent. Every analysis uses the same factors and the same forms of loss. Results from different teams can be compared, line by line.
- It shows its uncertainty. Results come as ranges and probabilities. A FAIR report says how confident it is.
- It is recognized. NIST maps FAIR to the Cybersecurity Framework,[3] and The Open Group publishes it as an open standard.[4]
Common misconceptions
- "FAIR needs perfect data." It does not. FAIR works with ranges, and analysts can use calibrated expert estimates where data is thin. The goal is accuracy: a range that contains the true value.[8]
- "FAIR replaces my control framework." It does not. FAIR measures risk. Frameworks such as the NIST CSF describe what to do about it. They work together.[2]
- "FAIR is only for IT." The model applies to any loss scenario.[8] But much of its reference material grew up around data breaches and IT systems. That matters for industrial companies, as the next section explains.
FAIR has honest limits too. Results are only as good as their inputs, and full analyses take skill and time. These limits are why many organizations use software and curated data sources to run FAIR at scale.
FAIR in industrial (OT) environments
FAIR's logic holds for operational technology (OT): risk is still frequency times magnitude. The gaps are in the detail around it, which grew up in IT.
Loss magnitude misses physical consequences. FAIR-MAM's hardware module covers replacing servers and laptops.[7] It does not describe a damaged turbine, transformer or production line. Nor does it name injury, environmental cleanup, a spoiled batch, or a regulator-ordered shutdown. In a plant, these are often the largest costs.
Controls mappings center on IT. FAIR-CAM's published mappings focus on IT control frameworks such as NIST SP 800-53, CIS Controls and ISO 27001.[2] Industrial controls, such as safety systems, network segmentation between plant and office, and manual operation during an outage, need their own treatment.
Evidence is thin. Serious OT cyber incidents are rare, and public loss data is limited. Insurers have little actuarial history to lean on. Waiting for decades of claims data is not an option. Simulation, built on FAIR's frequency and magnitude logic, is the practical way to understand rare but catastrophic losses.
DeNexus™ focuses on filling these gaps for industrial operators and the insurers who cover them. DeNexus research covers OT-specific loss types, industrial controls, and how OT attacks move from IT networks into the plant. As the pacesetter in OT cyber risk quantification, DeNexus brings that research into DeRISK™ CRQ, so FAIR-based results reflect how industrial sites actually lose money.
FAIR™, FAIR-MAM™ and FAIR-CAM™ are trademarks of the FAIR Institute. Open FAIR™ is a trademark of The Open Group. DeNexus is not affiliated with either organization. This article describes their published material for educational purposes; refer to the publishers' sites above for current guidance.
FAIR, extended for industrial sites
FAIR-MAM's hardware costs stop at servers and laptops. DeRISK CRQ adds what plants actually lose: damaged equipment, lost production and safety incidents. No OT network data needed to start.
See DeRISK CRQ in actionRelated Reading
- What Is OT Cyber Risk Quantification?
- What Is Open FAIR?
- How Certain Is a Cyber Risk Quantification Result?
References
- [1]
Jones, Jack, and Jack Freund, Measuring and Managing Information Risk: A FAIR Approach. Butterworth-Heinemann, 2015.
- [2]
FAIR Institute, FAIR™ Standards: Enabling a Risk-Based Approach to Cybersecurity and AI. Standards Booklet, version 2, FAIR Institute. URL: https://www.fairinstitute.org/
- [3]
Copeland, Jeff B., "NIST Maps FAIR to the CSF: Big Step Forward in Acceptance of Cyber Risk Quantification." FAIR Institute Blog, 19 Nov. 2019. URL: https://www.fairinstitute.org/blog/nist-maps-fair-to-the-csf-big-step-forward-in-acceptance-of-cyber-risk-quantification
- [4]
The Open Group, "Open FAIR™ Body of Knowledge." The Open Group. URL: https://www.opengroup.org/open-fair
- [5]
Goyal, Pankaj, Cody Scott, and Todd Tucker, "Announcing a FAIR Taxonomy for Cyber Risk Scenarios." FAIR Institute Blog, 26 Feb. 2025. URL: https://www.fairinstitute.org/blog/announcing-a-fair-taxonomy-for-cyber-risk-scenarios
- [6]
Maze, Taylor, "FAIR Beginner's Guide: What Do the Numbers Mean?" FAIR Institute Blog, 14 Jan. 2021. URL: https://www.fairinstitute.org/blog/fair-beginners-guide-what-do-the-numbers-mean
- [7]
FAIR Institute, An Introduction to the FAIR Materiality Assessment Model (FAIR-MAM™). FAIR Institute, 2023. URL: https://www.fairinstitute.org/resources/FAIR-MAM
- [8]
FAIR Institute, An Overview of FAIR-CAM: FAIR Controls Analytics Model. FAIR Institute. URL: https://www.fairinstitute.org/FAIR-CAM
- [9]
FAIR Institute, FAIR Controls Analytics Model (FAIR-CAM™) Standard. Version 1.0, FAIR Institute, Jan. 2025.